Debugging can be an intricate business, and we need a way to store the config for our bespoke setup - ports, paths, arguments, and so on - somewhere. VSCode uses launch.json for fine-grained control and having one will make it possible to start our app or attach to it in complex debug scenarios. Not having a launch.json was a temporary hack, but we’ll need one moving forwards. So let’s create one!
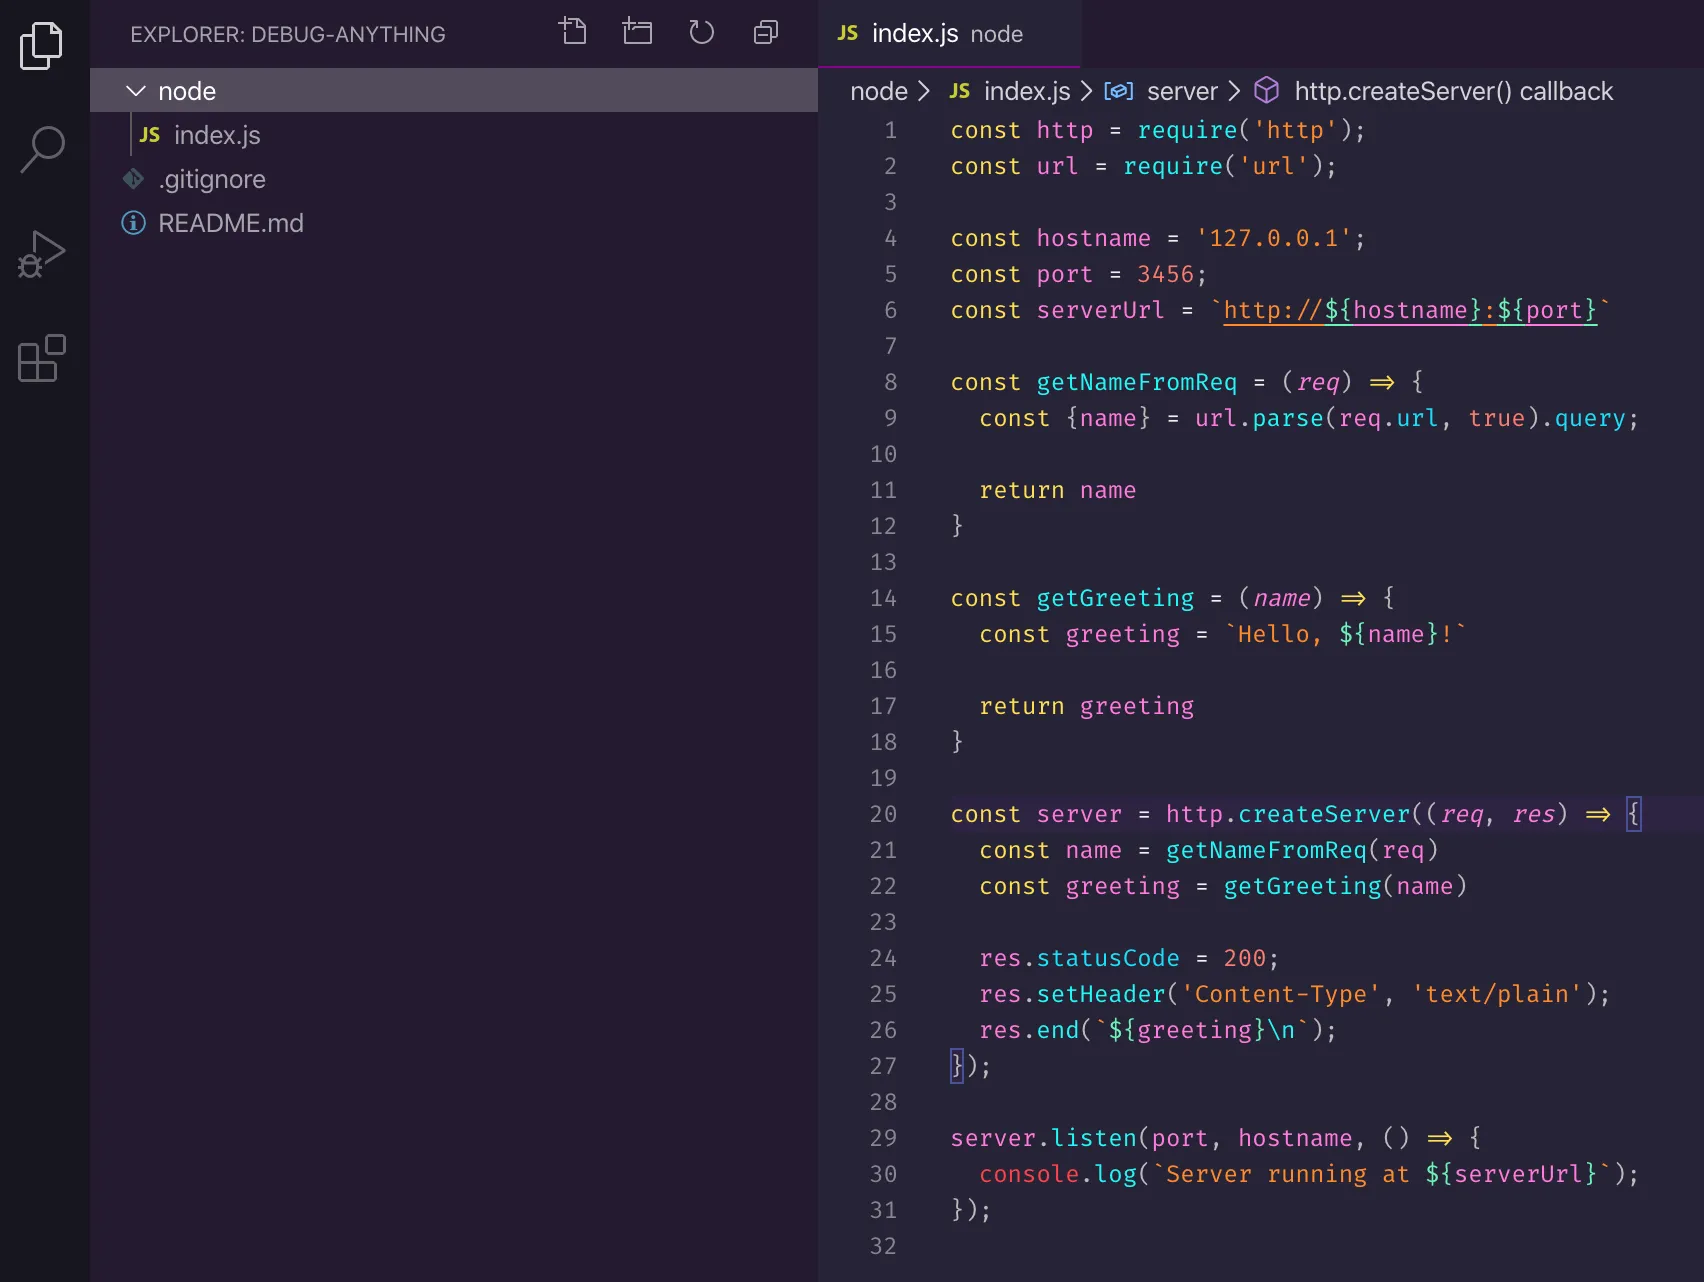
Make sure our sample code folder is open in VSCode:
launch.json
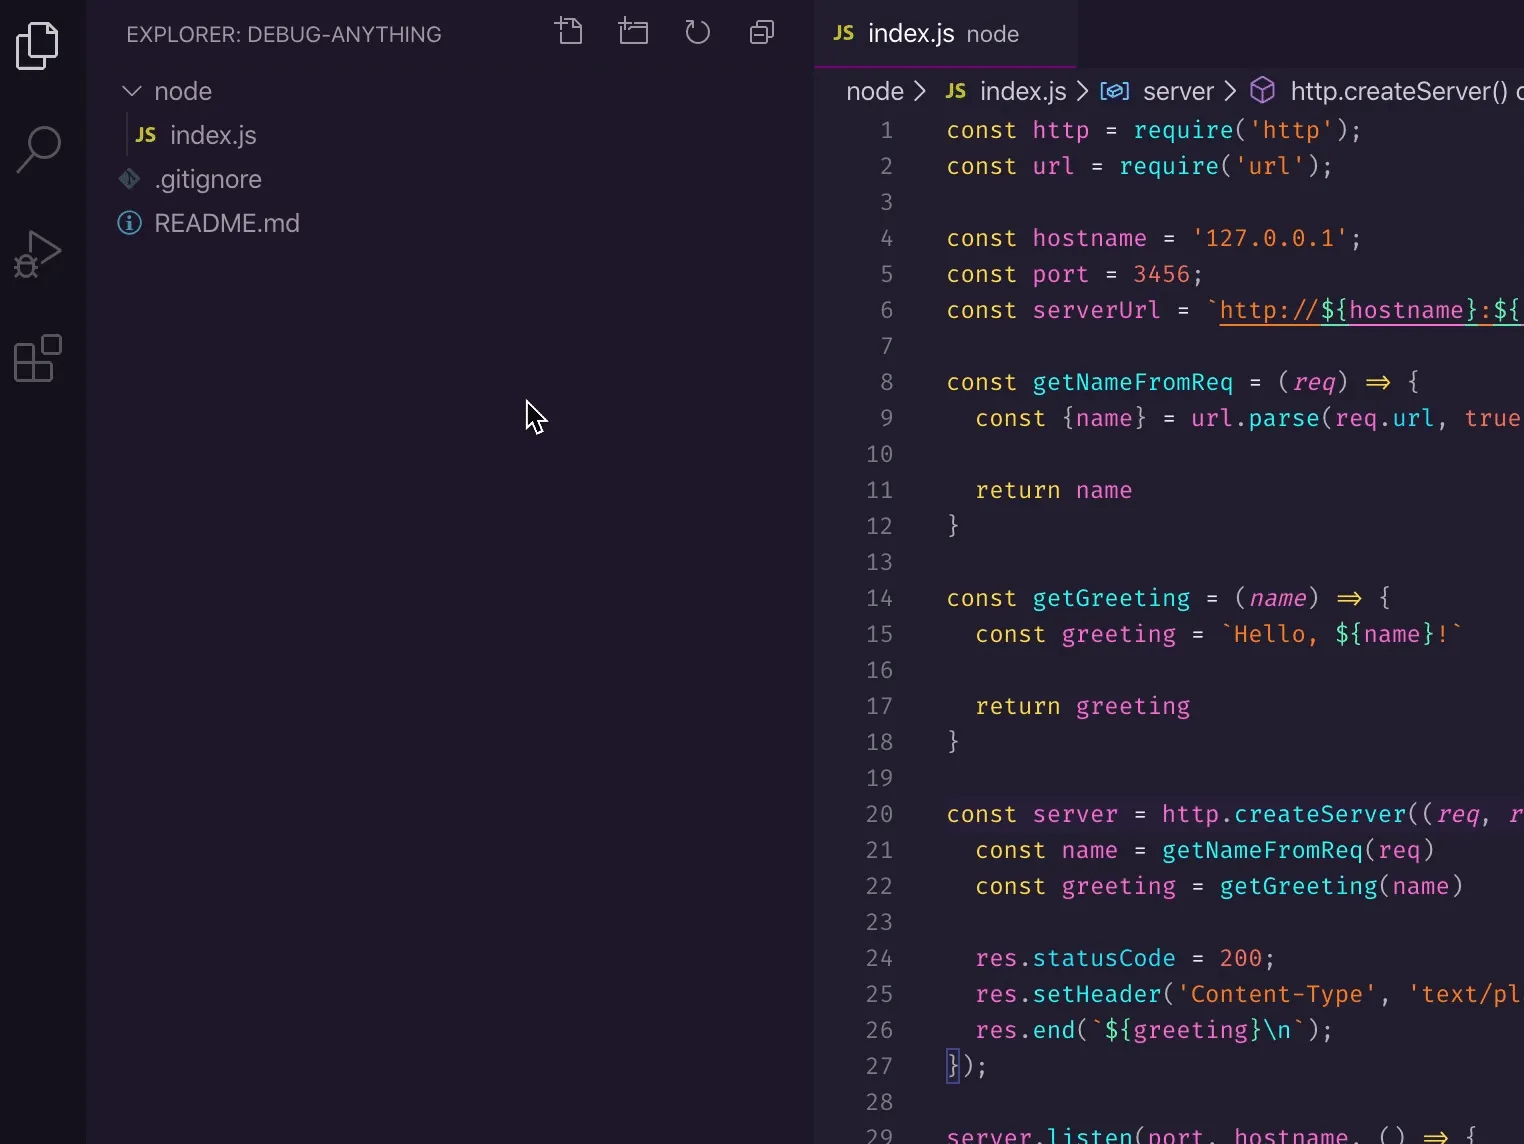
VSCode has a handy UI to generate a config skeleton. Let’s switch to the debug sidebar, click “create a launch.json file” and select Node.js:
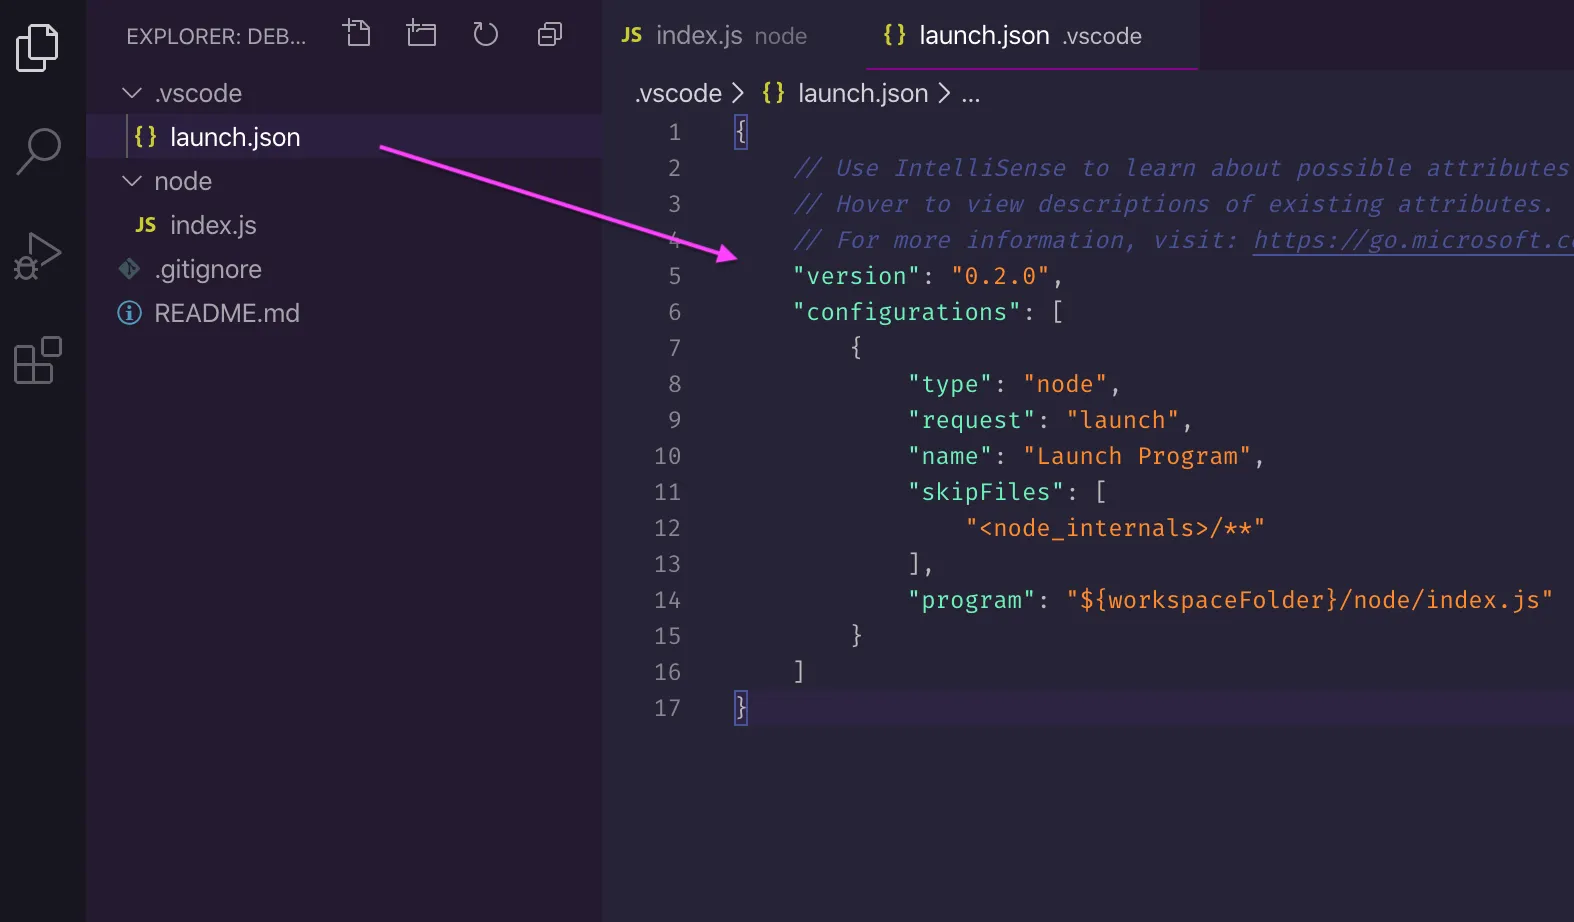
VSCode generates a new launch.json file under the .vscode folder in the workspace:
We’ll dig deeper into the file format and possible values in the future when we’ll look at different real-life scenarios and adapt the configuration as required.
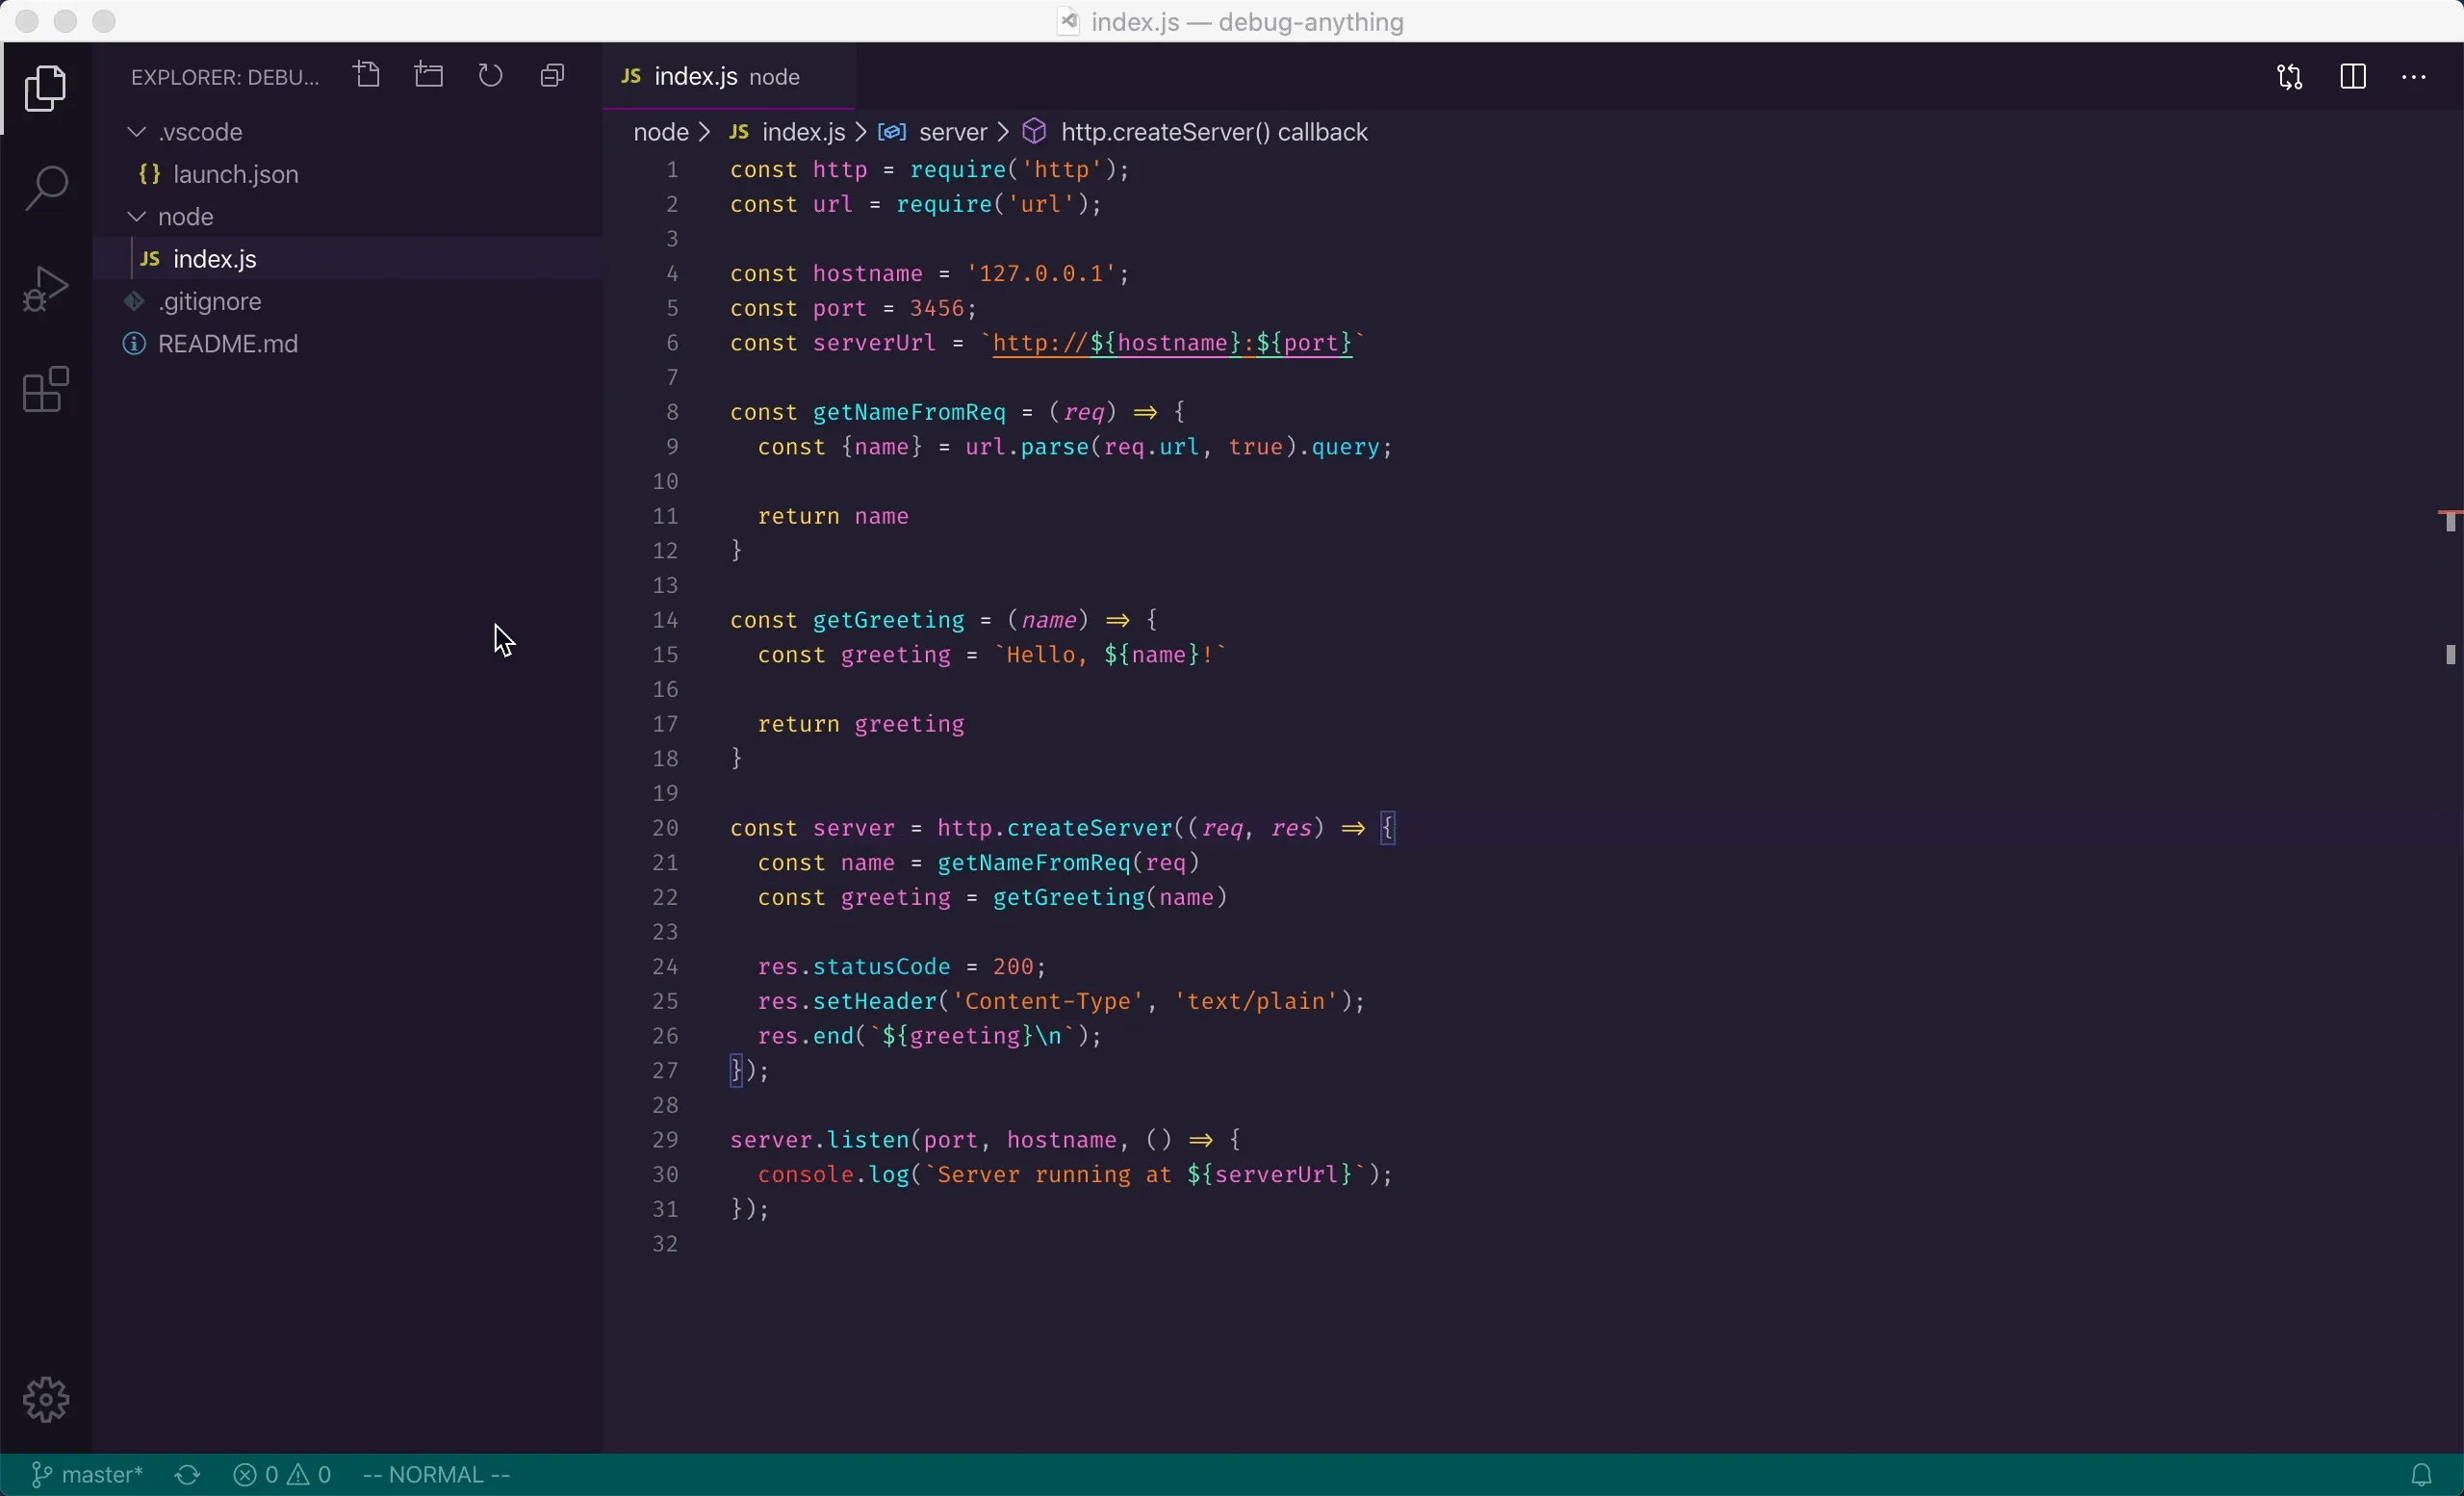
For now, it’s enough to observe that the presence of the config enables a launch menu in the debug sidebar which you can use to start the toy server 🧸 quickly:
You can refer to the excellent official documentation on creating the configuration and the possible configuration values if you’d like to understand more about this topic right now.
By the way, I’d suggest saving launch.json to your code repo. Having a shared one enables all team members to take advantage of proper debugging.
Debug Console
Note how the debug console also opened up automatically:

This console allows you to evaluate expressions in the context of the app running in the debugger. It is a pretty amazing and convenient tool! You can inspect any variable in the scope, similar to the debug sidebar. But you can also run any function in scope, or literally run any code you want, even require modules - inside your running app 🤯
Let’s see an example. Make sure to add a breakpoint on line 24 and fire off a request:
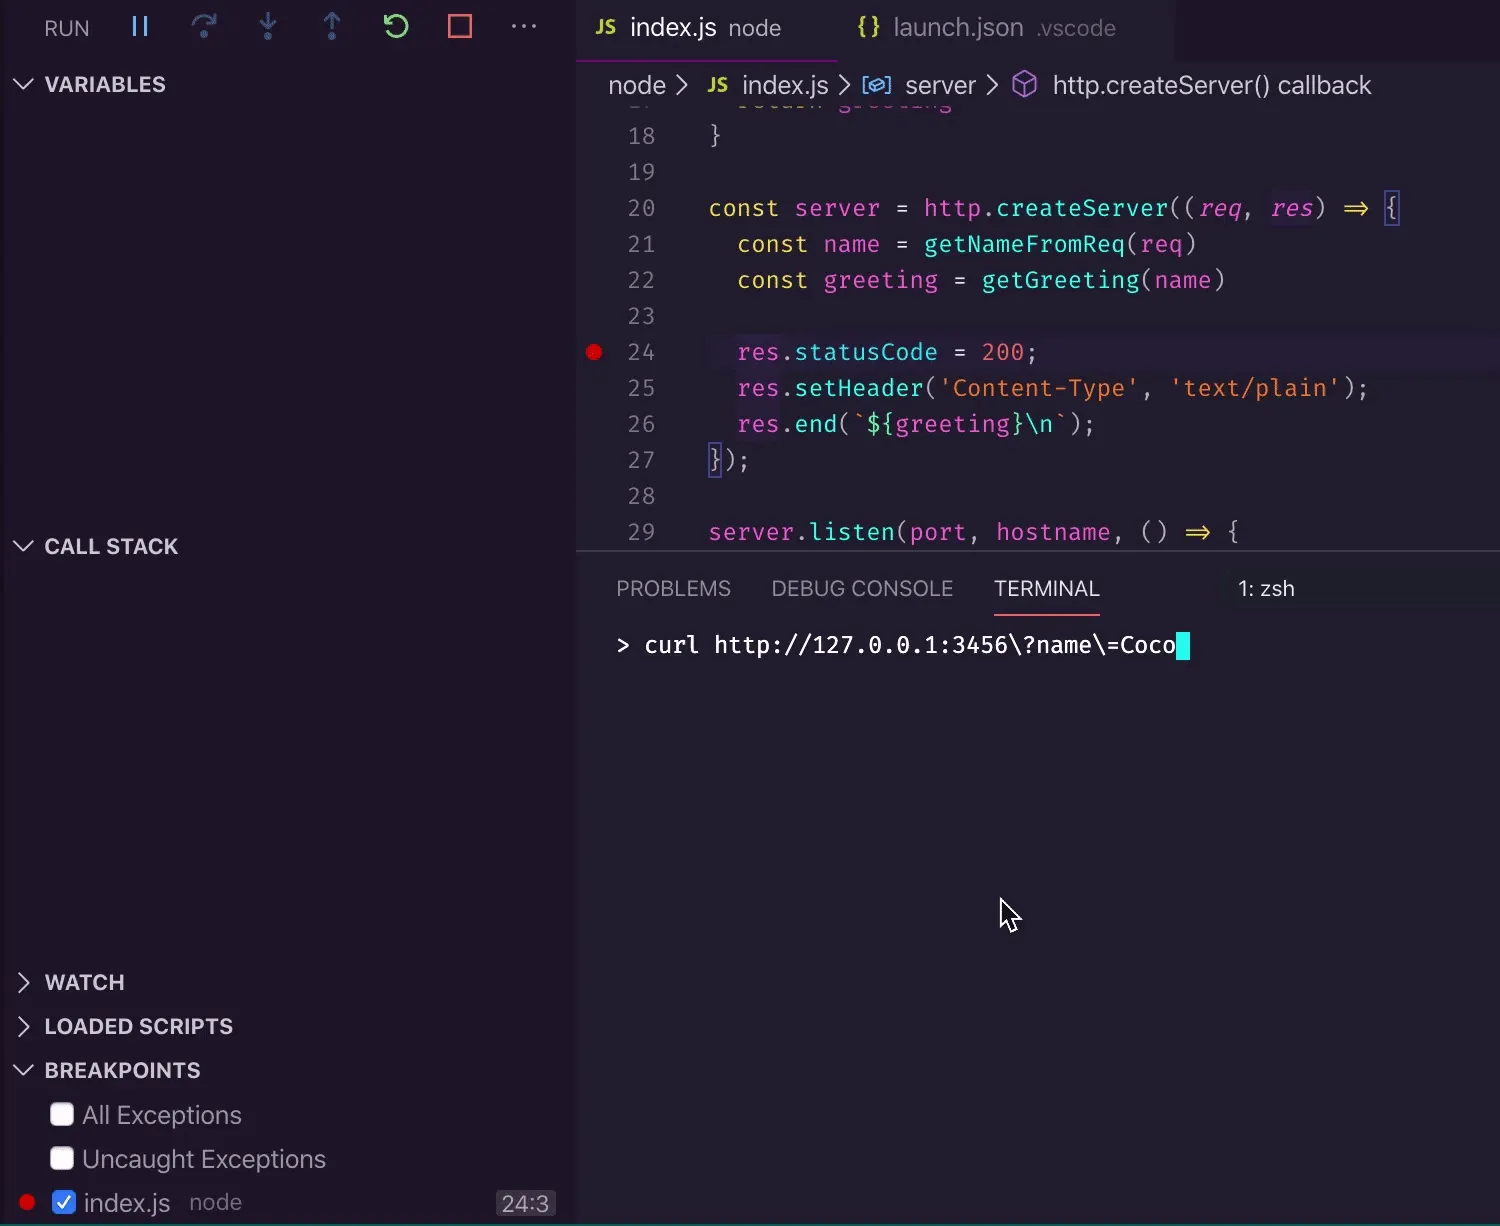
As demonstrated, you can type in any local variable (or function) name, and you even get auto-completion.
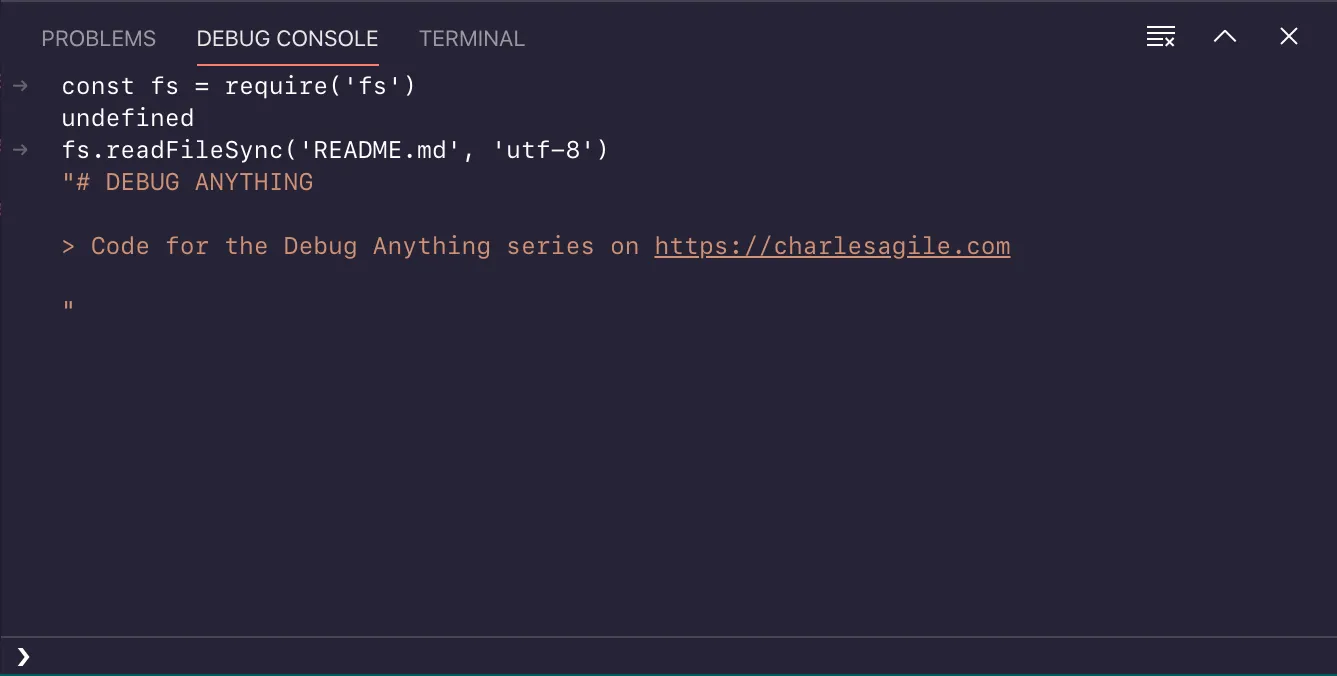
But, as mentioned above, you’re not limited to your app’s code - you can import any available module:
Have fun exploring the debug console! 🥼