Get the code
You can skip ahead if you already have a React, TypeScript and Parcel project. Otherwise, let’s check out the example code:
git clone git@github.com:thekarel/debug-anything.git
cd debug-anything/parcel
yarn # or npm i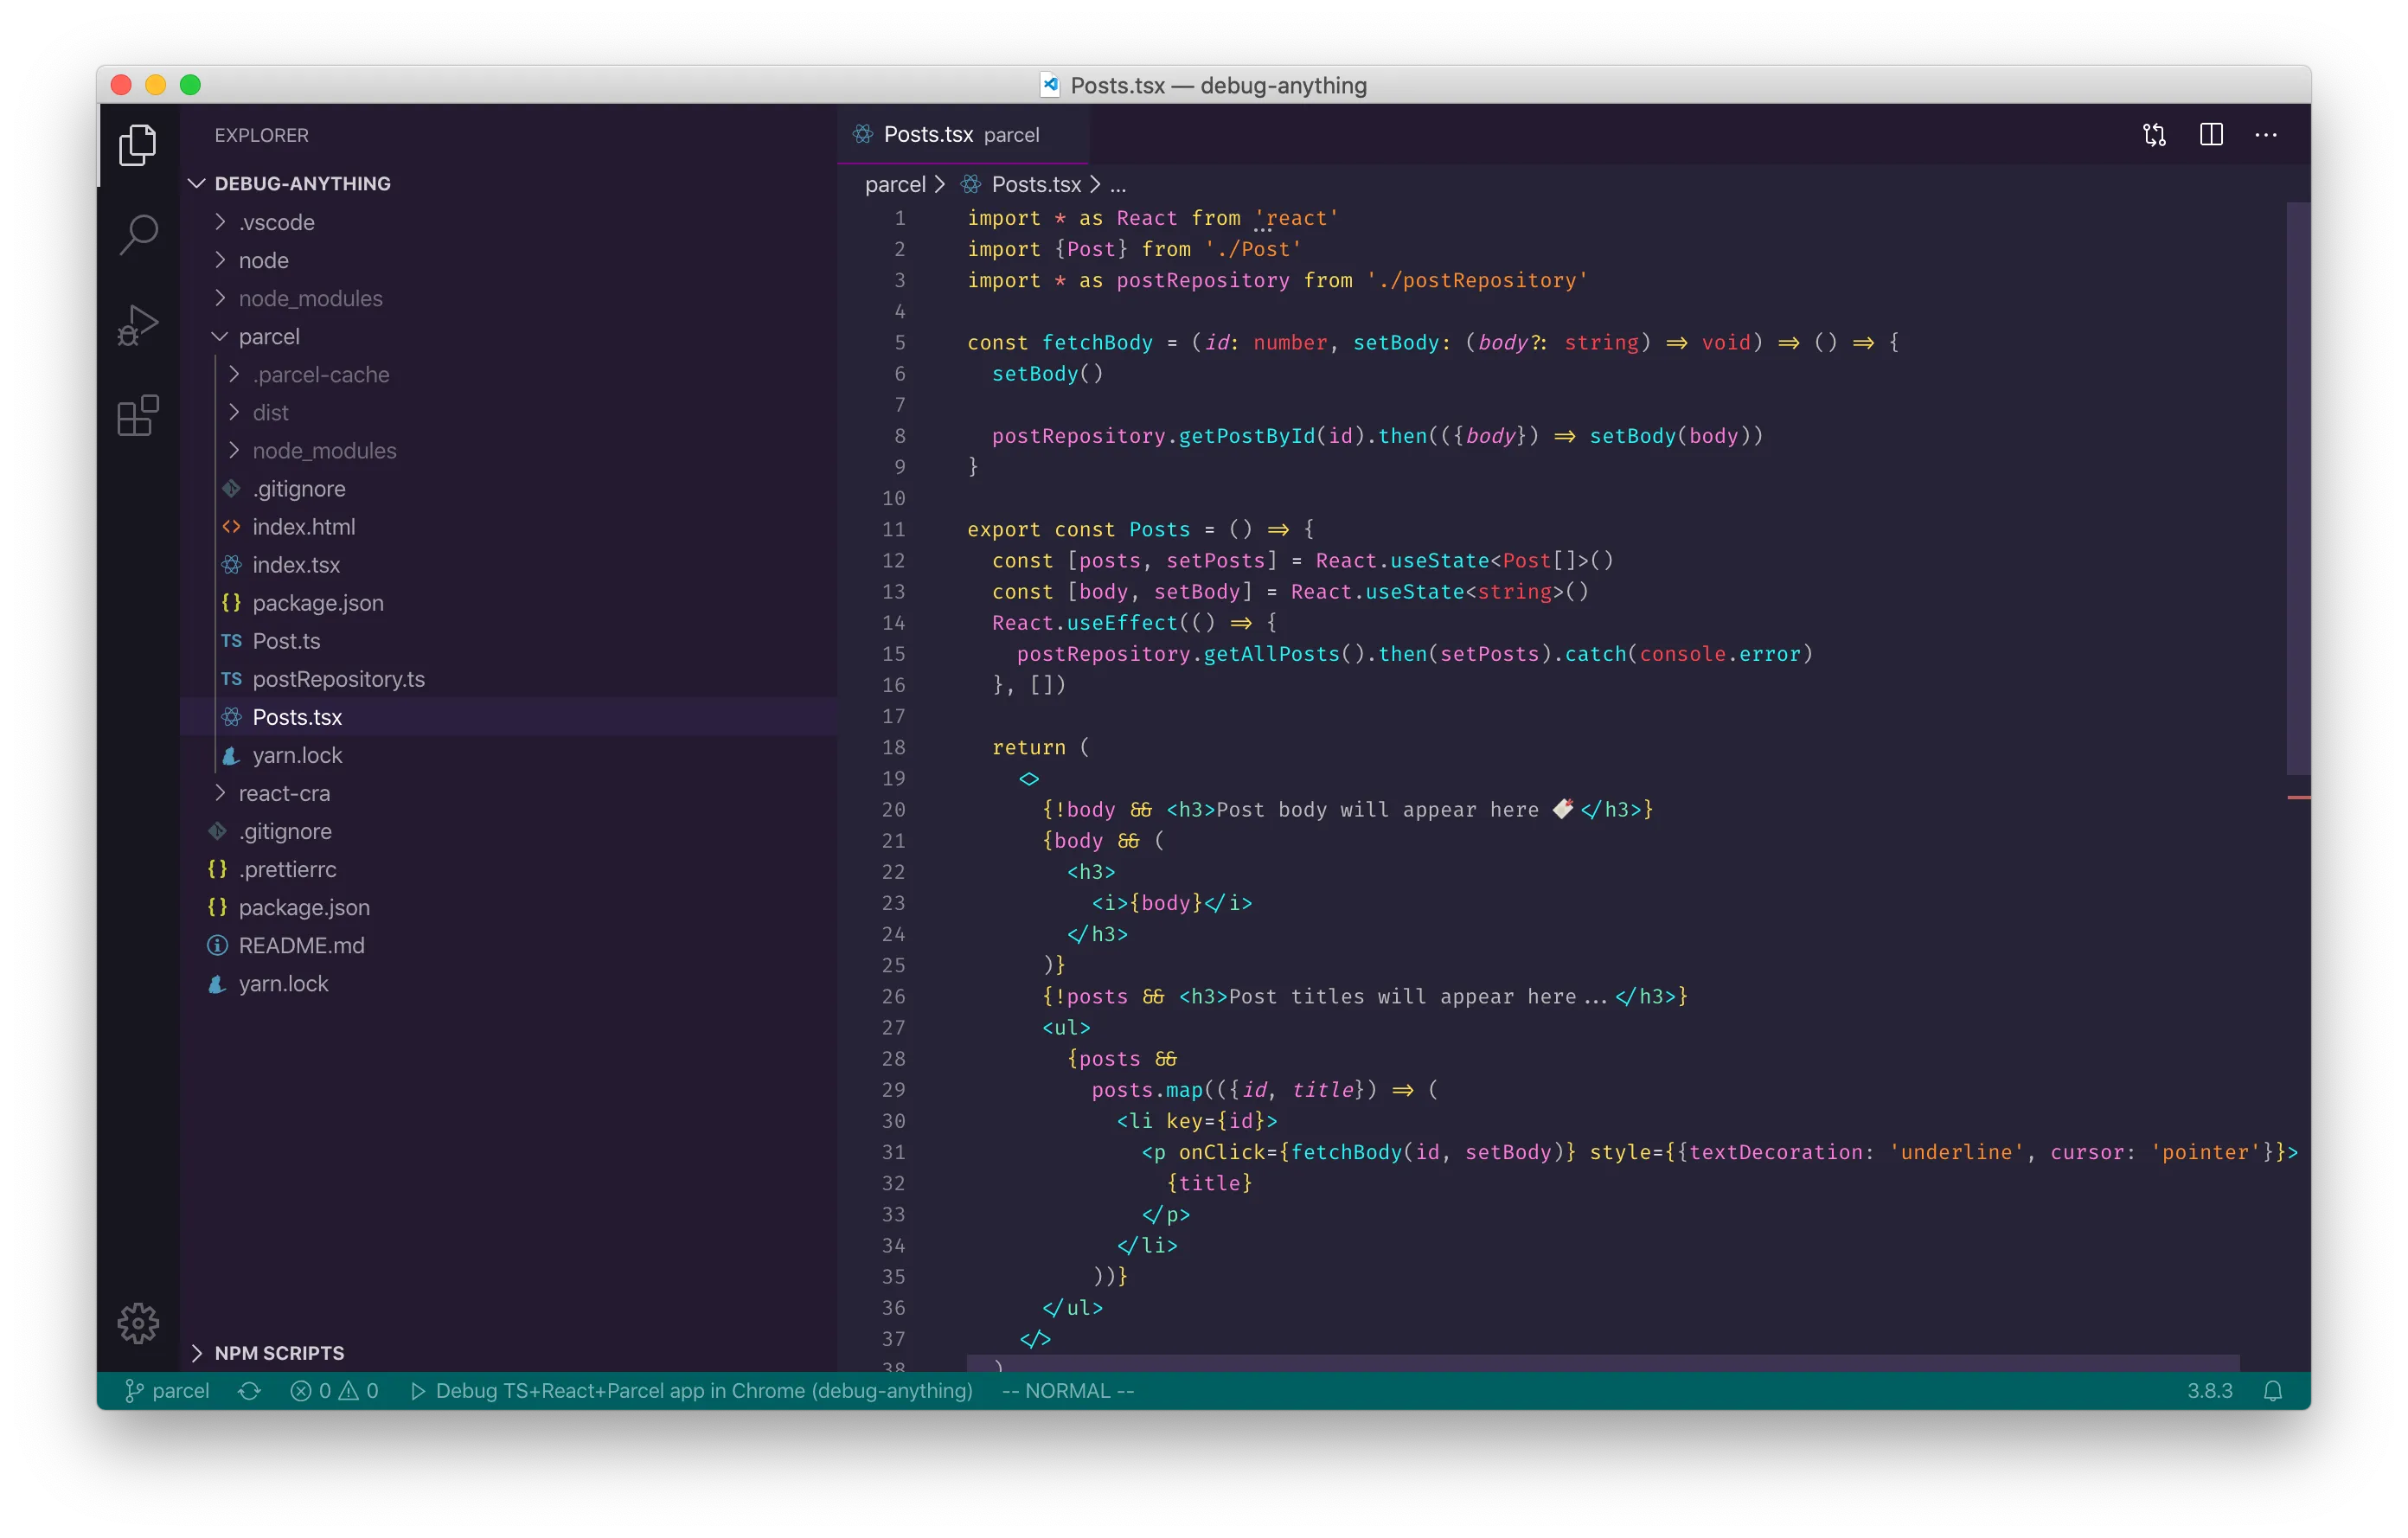
Code structure
The application itself is elementary: you’ll see a list of fake blog post titles, clicking on a title will fetch the body of the post and display it above the list.
The code in this folder is, as usual, kept as simple as possible so that we can focus our attention on the debugger. In a production app, we’d use a human-friendly folder structure. The entry point is index.html which pulls in index.tsx and runs the basic React app.
You should focus on the following files:
Post.ts # The Post interface type
Posts.tsx # The post-list React component
index.html # The entry-point
index.tsx # The React app
postRepository.ts # Data fetching module
Less than 100 lines altogether, so don’t expect anything revolutionary 😉
Parcel
You might be wondering where is the Webpack or Babel configuration file? Well, there’s none! Since Parcel is a zero-configuration bundler, we can just tell it to compile the code, and it Just Works all the time. I find it easier to work with than other solutions like Create React App as it’s so simple and fast.
In this example, we can bundle the whole React app, written in TypeScript, by simply pointing Parcel to index.html - and that’s all the plumbing we need. One less thing to worry about. Deserves a star ⭐️ on GitHub 👍
Note: this example code uses Parcel 2 alpha 3.
Dev server
Let’s start the dev server with yarn start or npm start:
╰─$ yarn start
yarn run v1.22.4
$ parcel index.html
ℹ️ Server running at http://localhost:1234
✨ Built in 548ms
Make sure you can visit http://localhost:1234
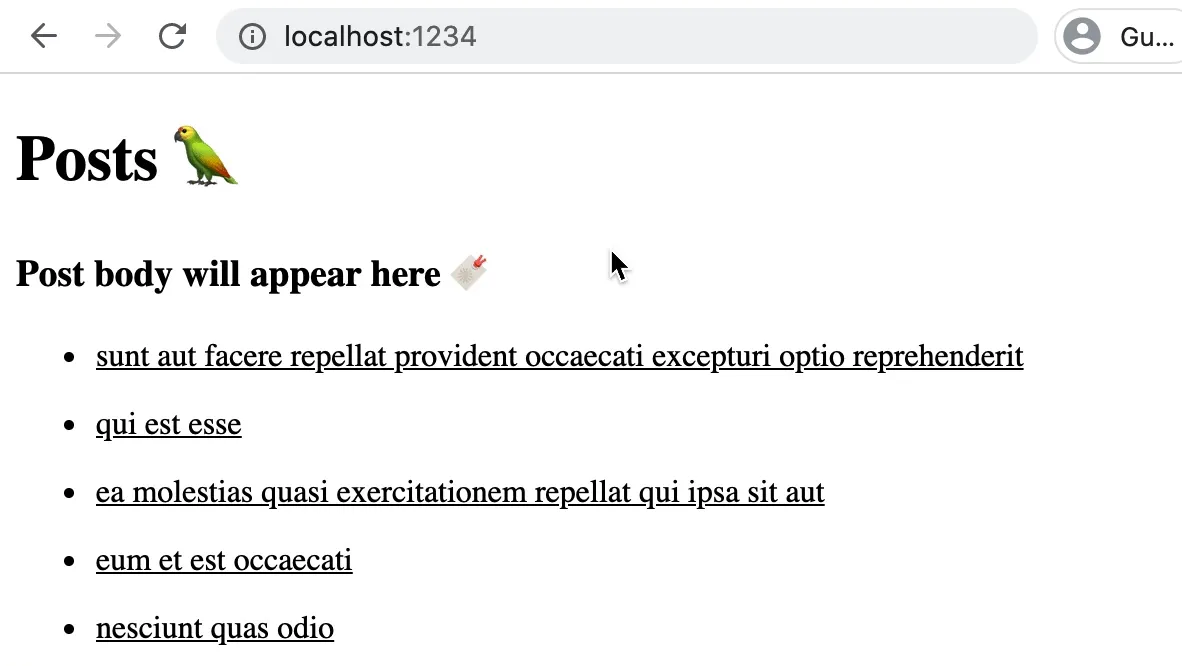
The “app” fetches the list of posts on start, then grabs the selected post’s body from the server on click.
Configure the debugger
What we’d like to achieve in terms of debugging, is to be able to set breakpoints in VS Code, launch a debug browser and step through the initial list fetch and subsequent remote requests.
To make this as easy and comfortable as possible, we’ll take advantage of the launch.json configuration file. It’s actually all prepared for you 😌
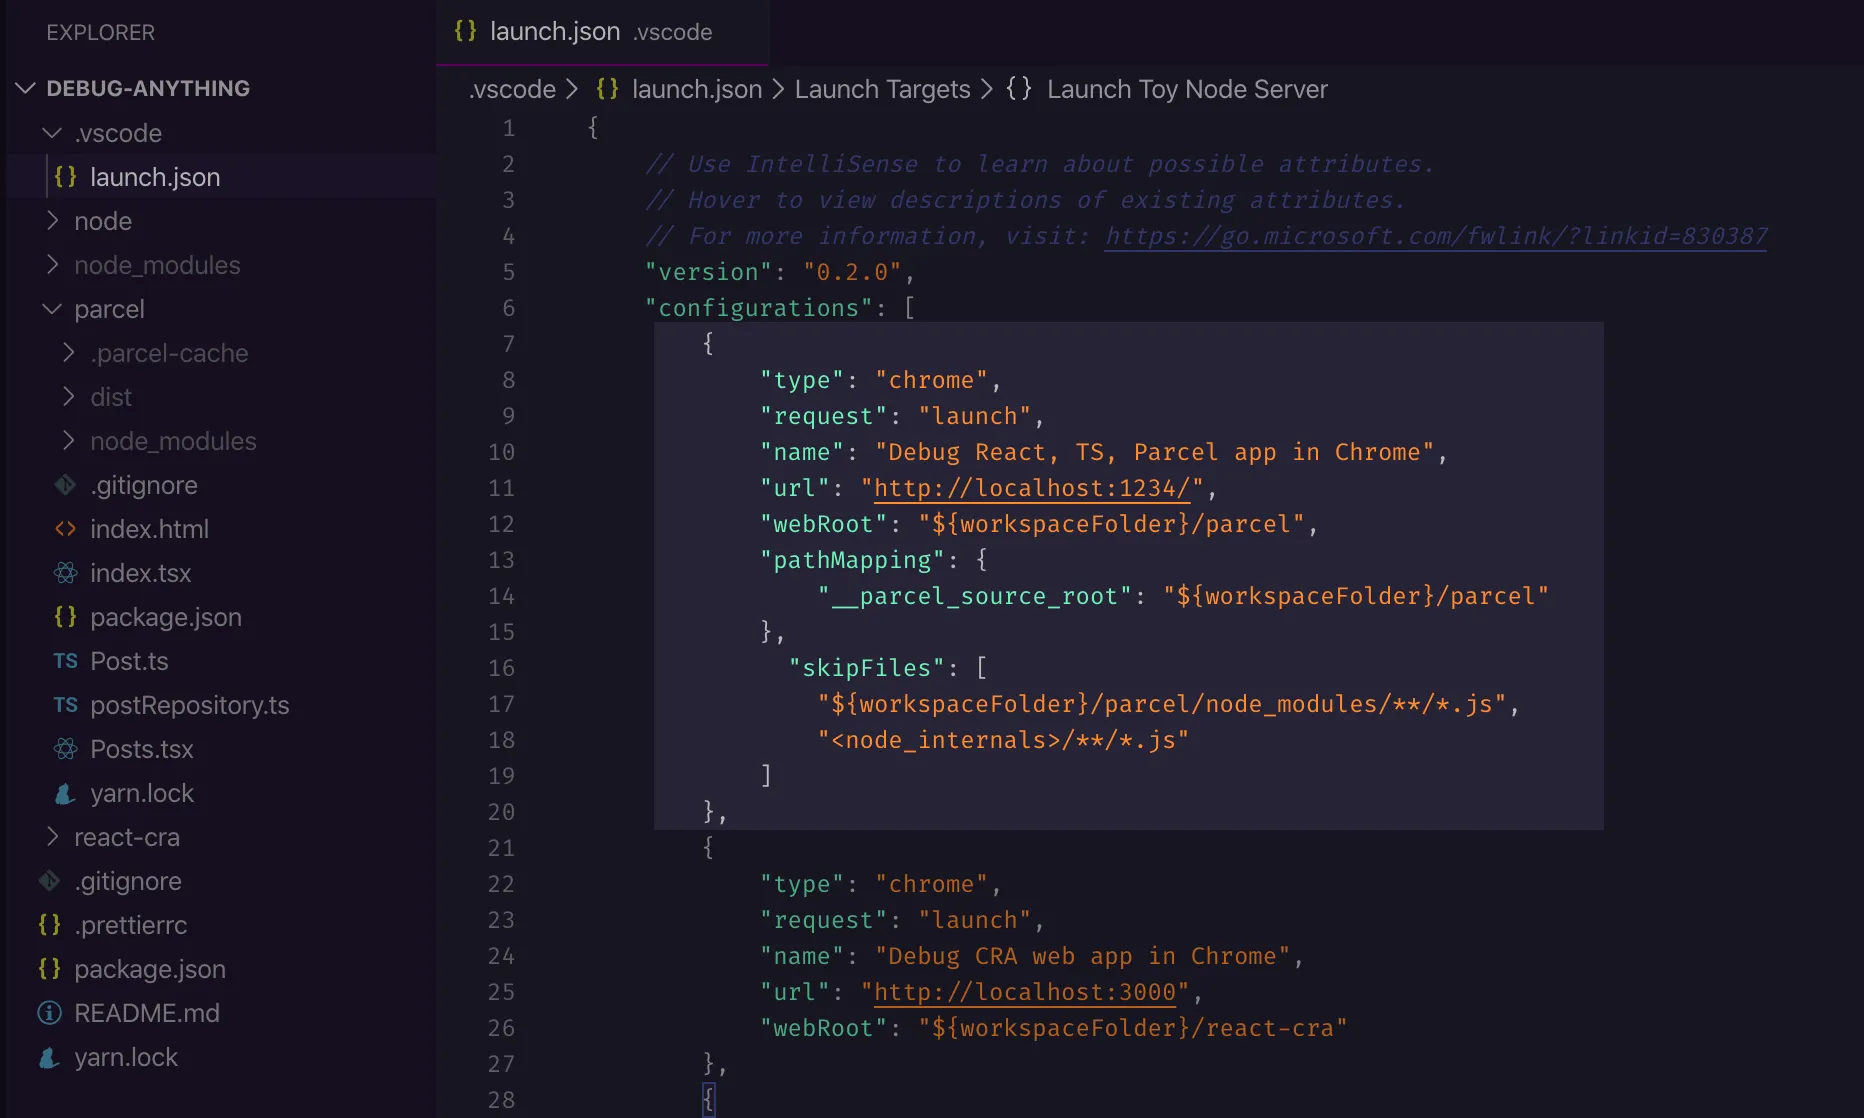
Let’s look at .vscode/launch.json and focus on the React+TS, Parcel section:
{
    "type": "chrome",
    "request": "launch",
    "name": "Debug React, TS, Parcel app in Chrome",
    "url": "http://localhost:1234/",
    "webRoot": "${workspaceFolder}/parcel",
    "pathMapping": {
        "__parcel_source_root": "${workspaceFolder}/parcel"
    },
        "skipFiles": [
        "${workspaceFolder}/parcel/node_modules/**/*.js",
        "<node_internals>/**/*.js"
    ]
},
The config is very similar to our Create React App example, by the way.
The type and request parameters tell VS Code to start debugging in a new Chrome window. It will use an empty profile by the way, without extensions or personal settings.
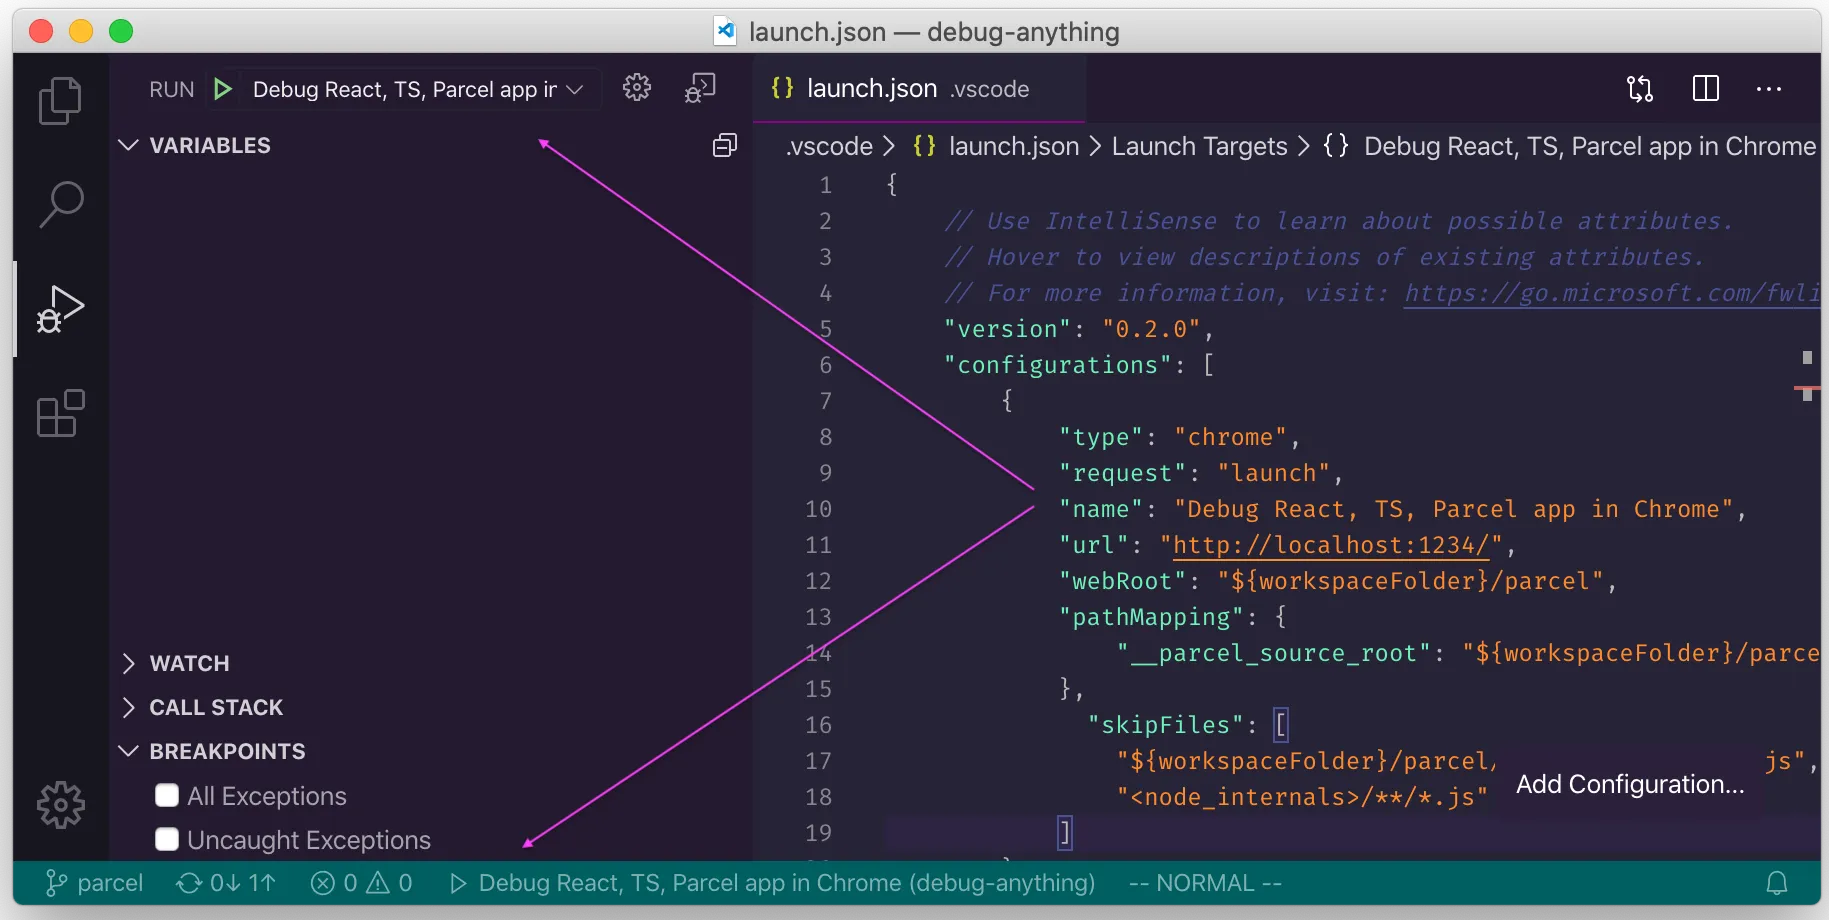
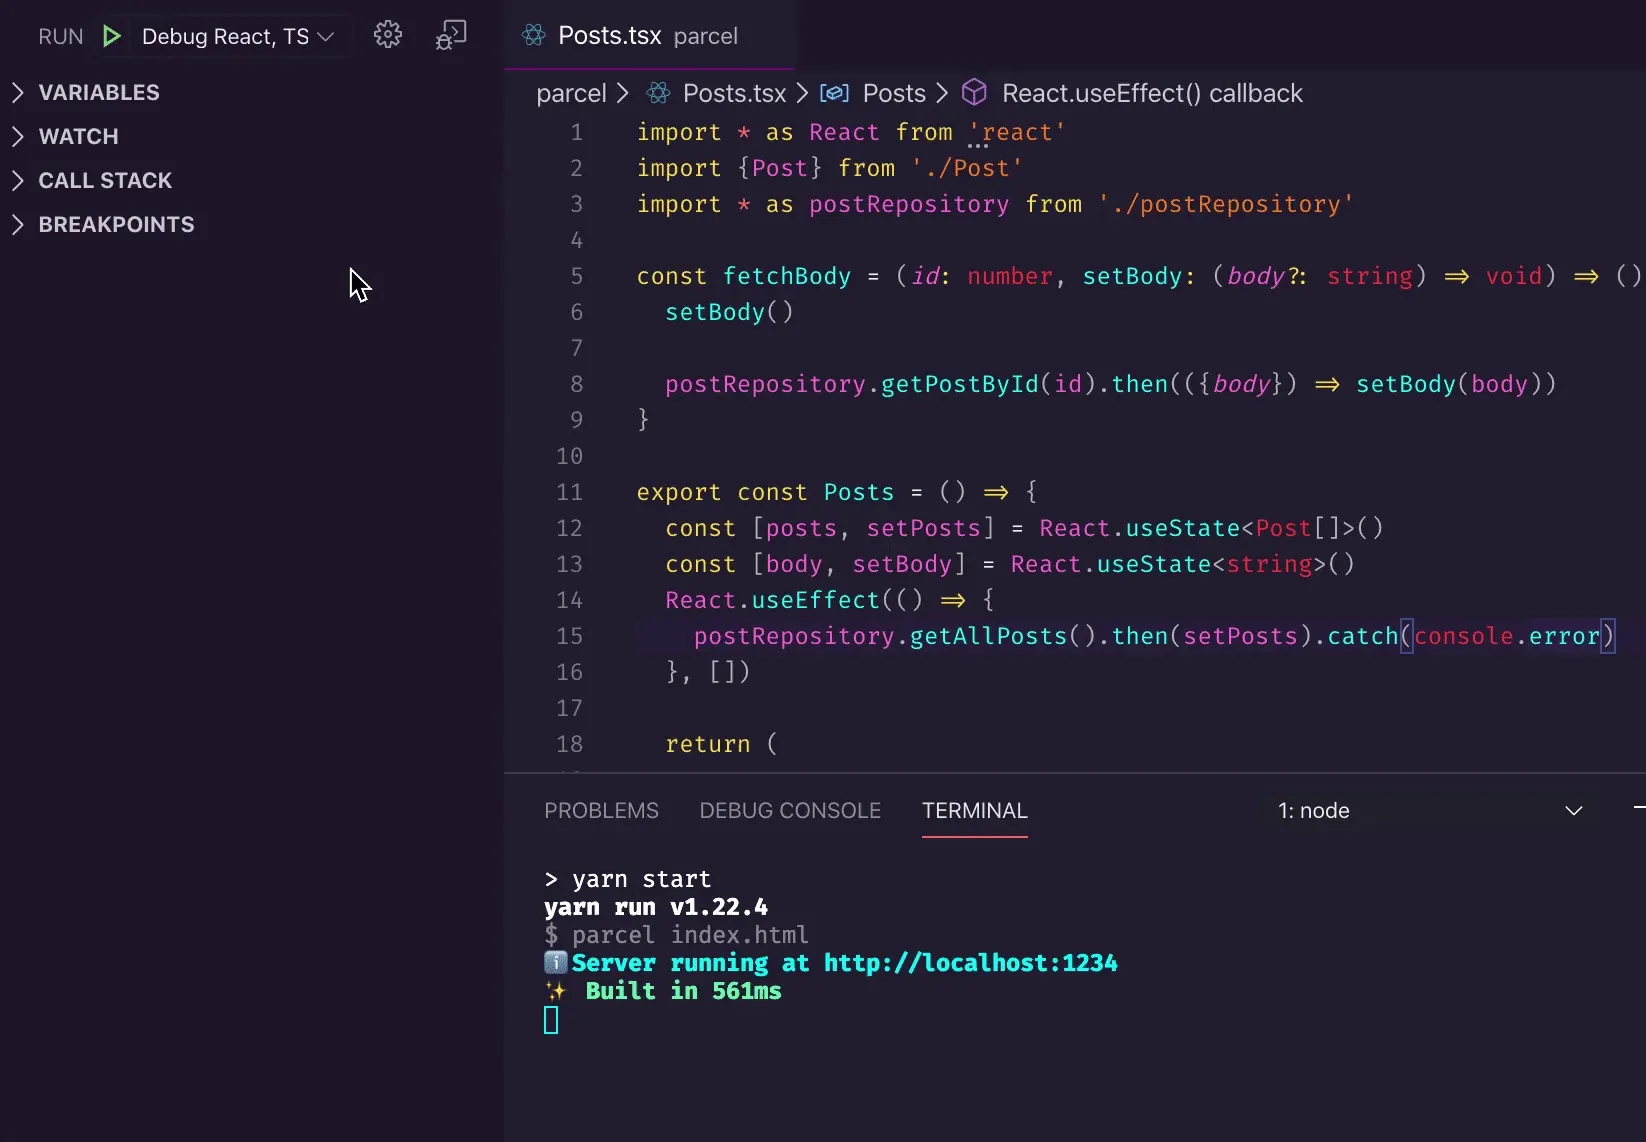
The name of the launcher will appear in the debug toolbar, plus the status bar of the IDE, after the 1st run:
The url needs to match the address where our dev version is served (http://localhost:1234/ by default).
webRoot: the filesystem path that matches the root of the dev server. It is usually the folder where the entry point is kept - in our case the folder where index.html is. Keep in mind that the example code repo houses multiple small projects. In a single-project repo, "webRoot": "${workspaceFolder}/src" is a good first guess.
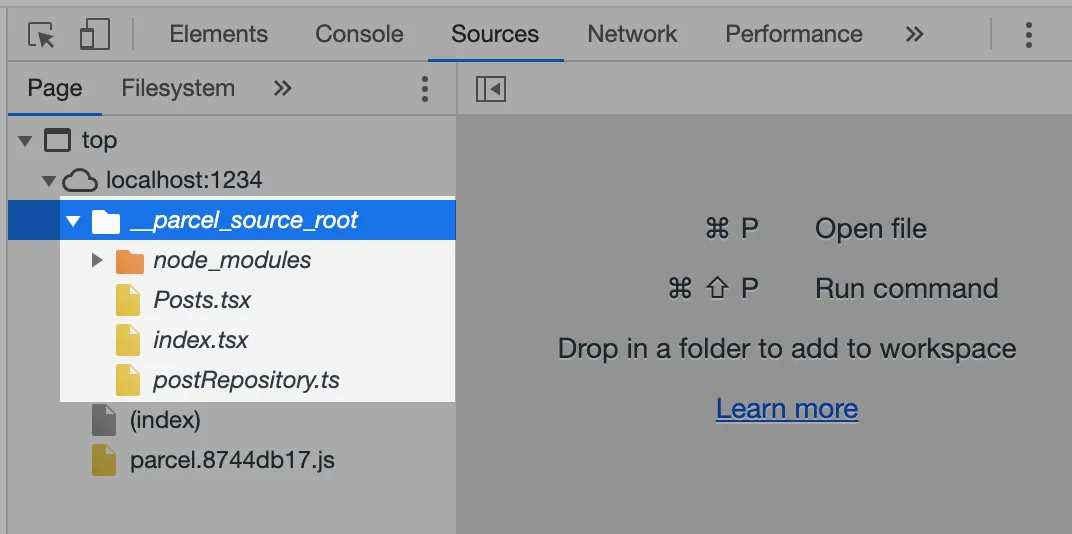
pathMapping: this option is required in our case, as Parcel serves up a source-map that makes it look like the original files are under /__parcel_source_root. Without this setting VS Code would be unable to map breakpoint locations in the source to runtime code:
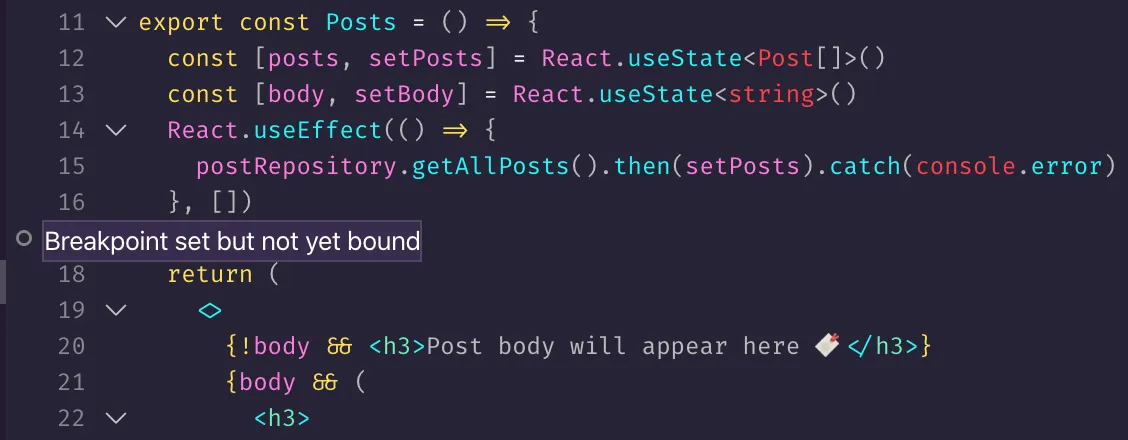
Check your
pathMappingif you encounter “Breakpoint set but not yet bound” issues
You can find the correct path in the debug browser by the way. In Chrome, open the dev console and go to Sources:
Finally, we set skipFiles so that the debugger never steps into 3rd party or core Node.js modules. Skipping such files is useful if you want to focus on your codebase and are not interested in spending time looking at library code—a highly recommended tweak.
React + TypeScript debugger in action
Make sure the dev server is running, then launch the debug browser:
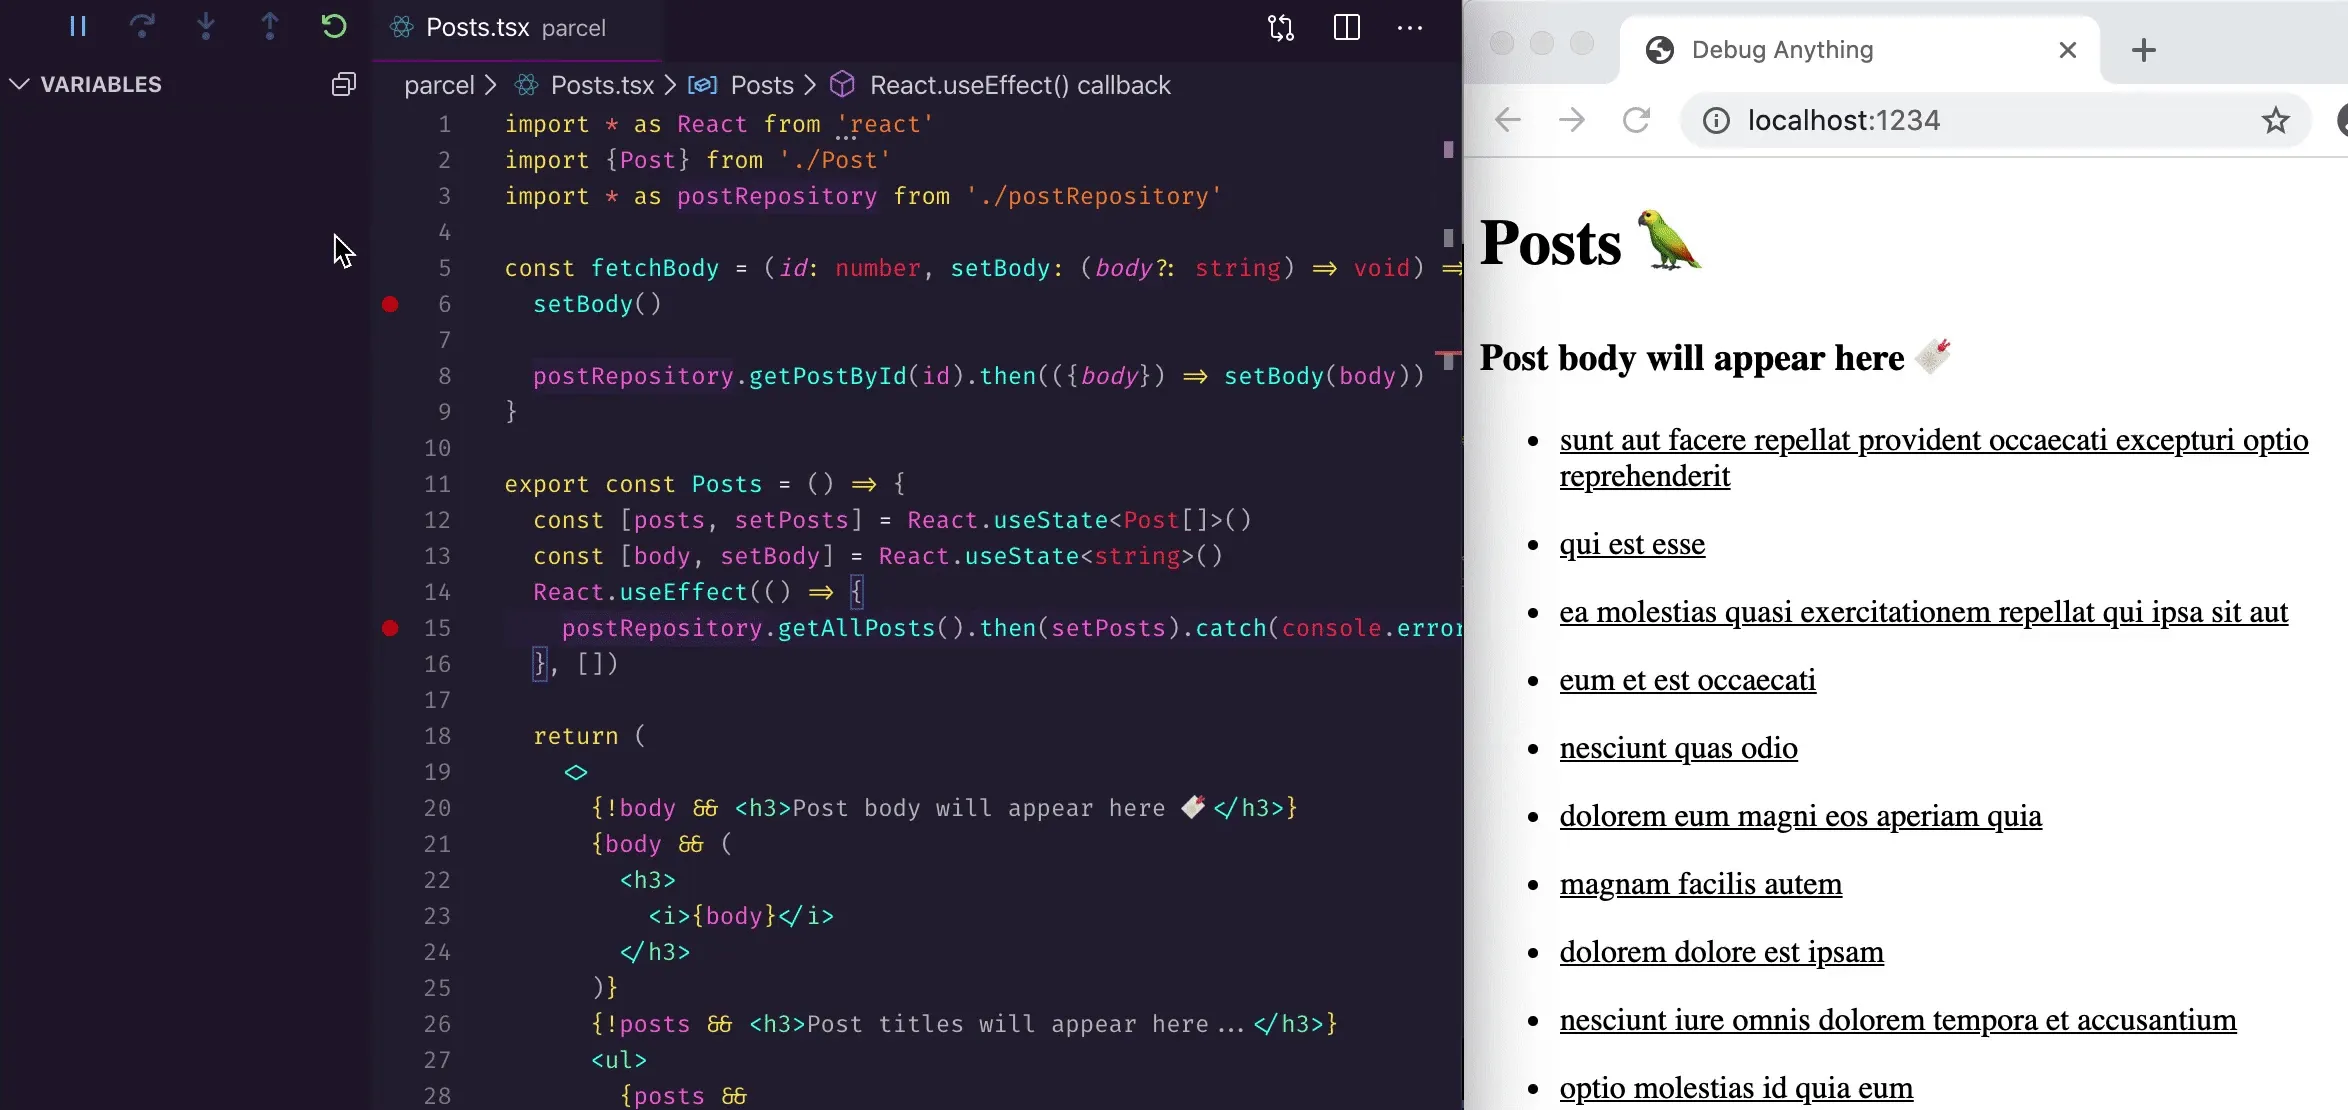
Let’s add two breakpoints: one inside the fetchBody function, another into the useEffect hook:
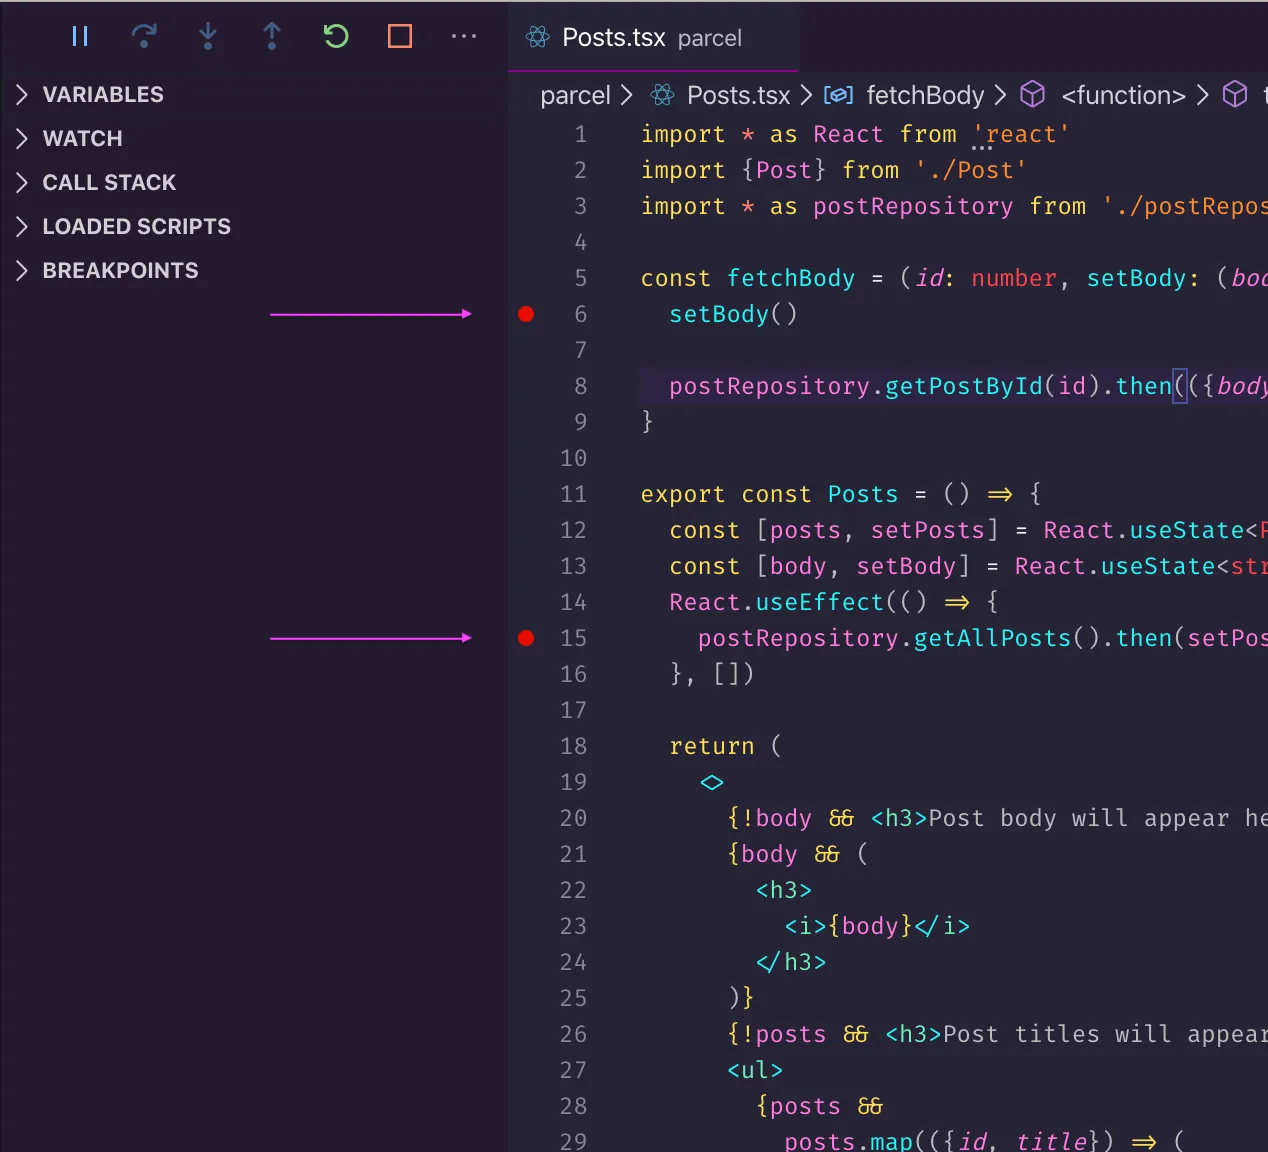
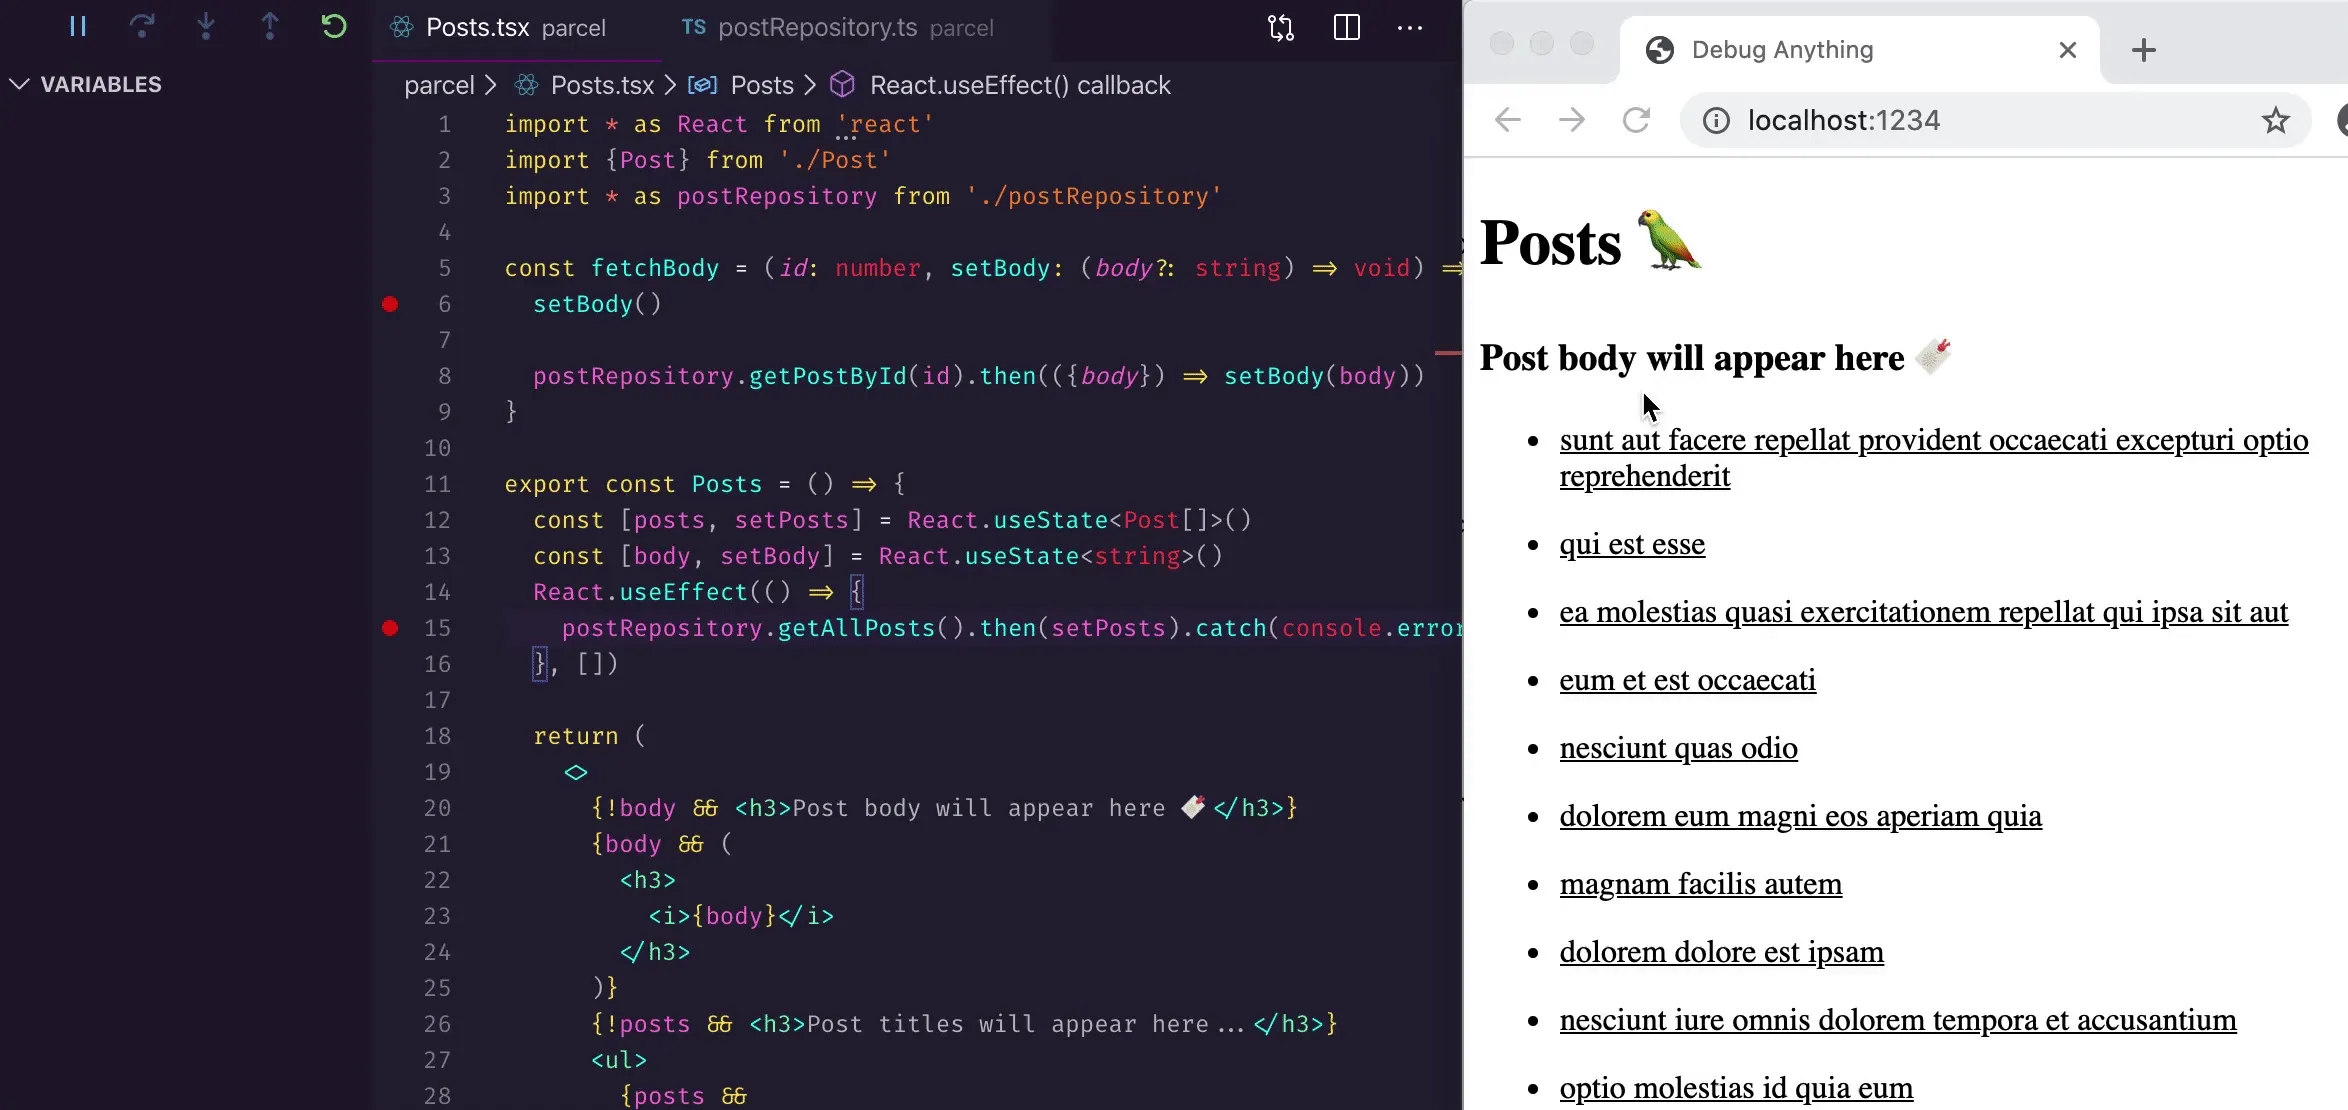
Now we can restart the debugger (not the server!) and check the hook’s behaviour when the component is mounted first:
Next, we can follow the code flow of fetchBody - note how we never see any core or 3rd party libraries (like Fetch or React internals):
Hopefully, you’ll be able to implement a comfortable debug workflow in your React/TypeScript app based on this template ✌️
Have any tips or comments to share? Let me know!