In the previous episode we’ve started exploring the VS Code debugger. We’ve added breakpoints to our tiny codebase and glanced at the local state.
This time we’ll learn how to follow the code execution line by line and how to jump in and out of function calls.
Get the code
First, let’s change our single-function server into something more complex. We’ll add two extra functions: one to get the name from the request and another to generate the greeting.
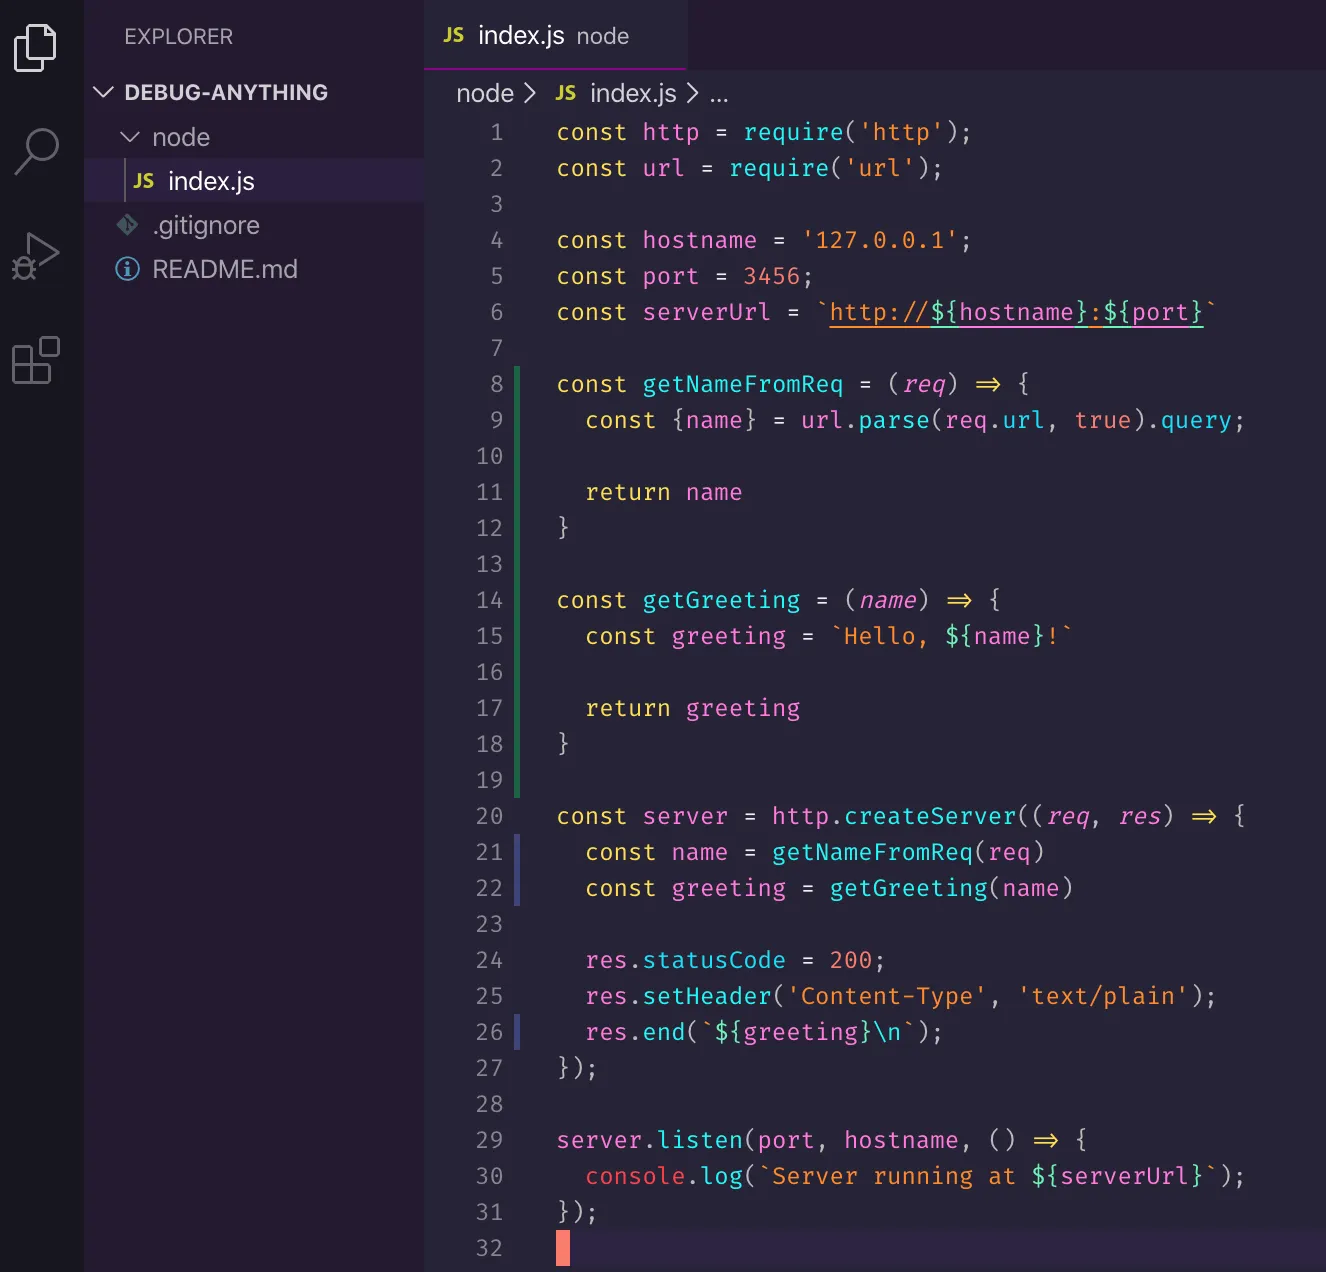
You can copy-paste this code as index.js in an empty folder.
const http = require('http');
const url = require('url');

const hostname = '127.0.0.1';
const port = 3456;
const serverUrl = `http://${hostname}:${port}`

const getNameFromReq = (req) => {
  const {name} = url.parse(req.url, true).query;

  return name
}

const getGreeting = (name) => {
  const greeting = `Hello, ${name}!`

  return greeting
}

const server = http.createServer((req, res) => {
  const name = getNameFromReq(req)
  const greeting = getGreeting(name)

  res.statusCode = 200;
  res.setHeader('Content-Type', 'text/plain');
  res.end(`${greeting}\n`);
});

server.listen(port, hostname, () => {
  console.log(`Server running at ${serverUrl}`);
});
The code for the series is available at https://github.com/thekarel/debug-anything
Start the debugger
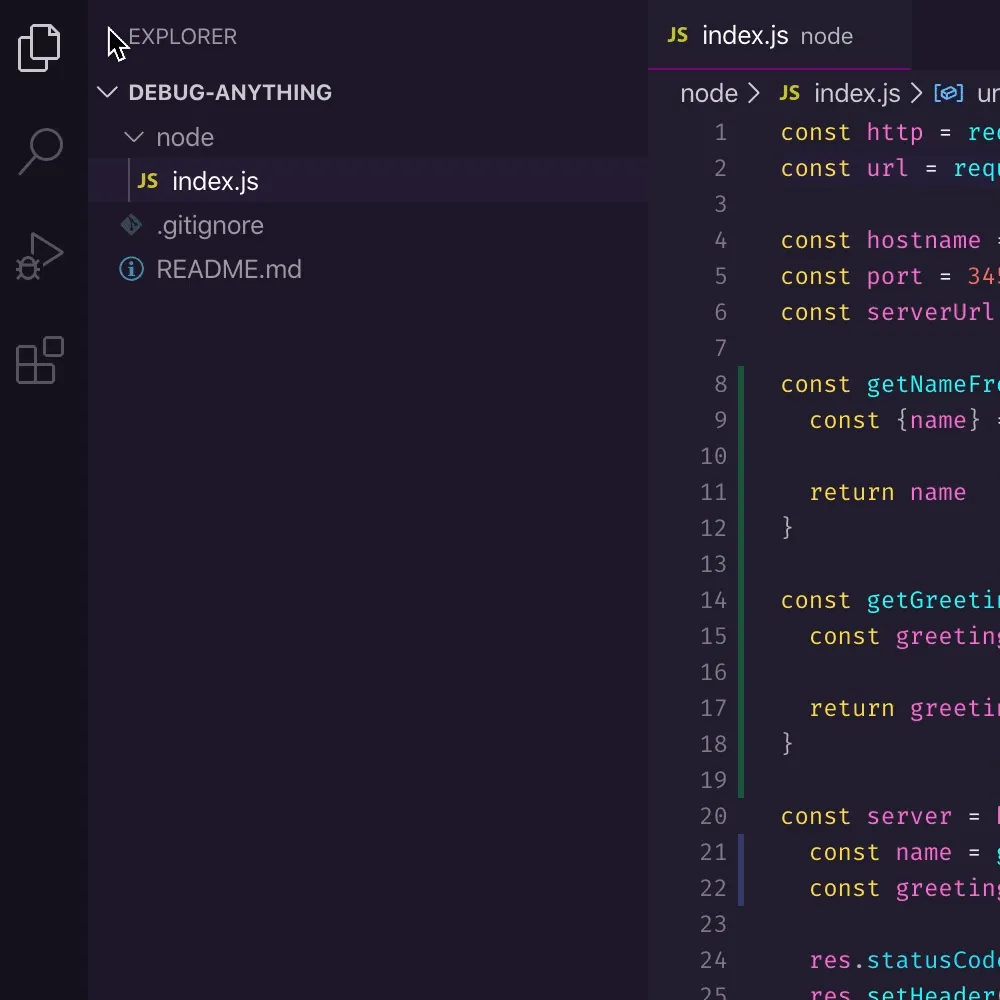
Let’s start the debugger: use the debug toolbar or press F5 and select Node.js:
You should be able to visit http://127.0.0.1:3456/?name=Coco as usual and see a greeting.
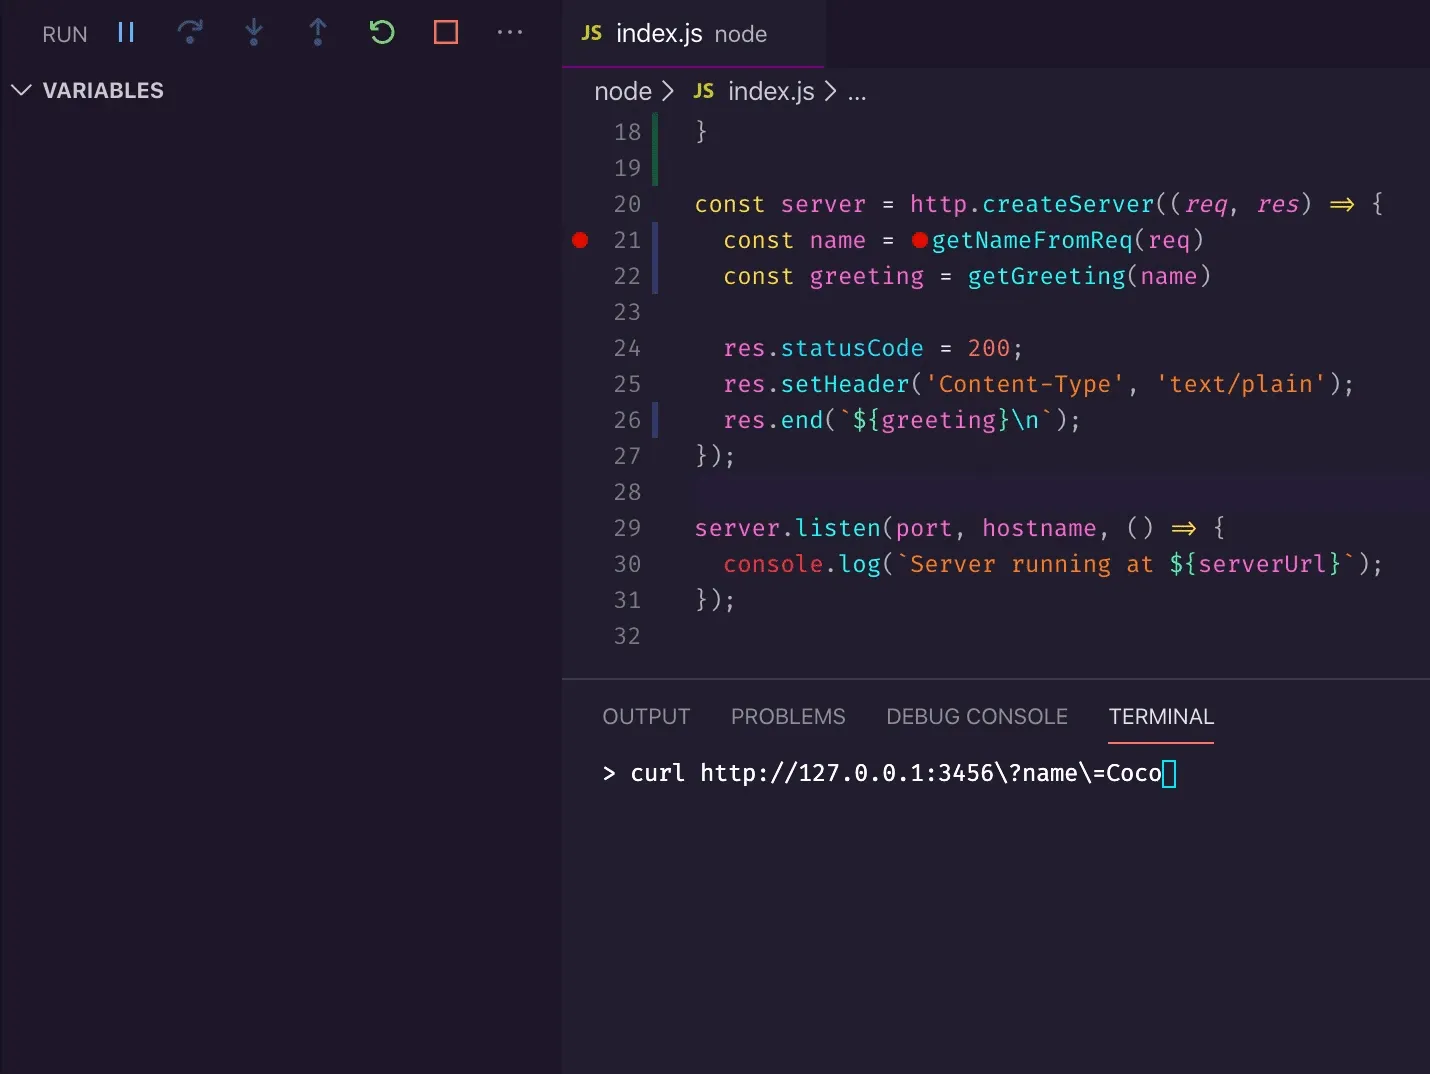
You can also use
curl http://127.0.0.1:3456\?name\=Cocoif you’re that kind of person
Ok, so far we’ve only established the server is up and running - let’s add a breakpoint. Without a breakpoint, the debugger wouldn’t start:
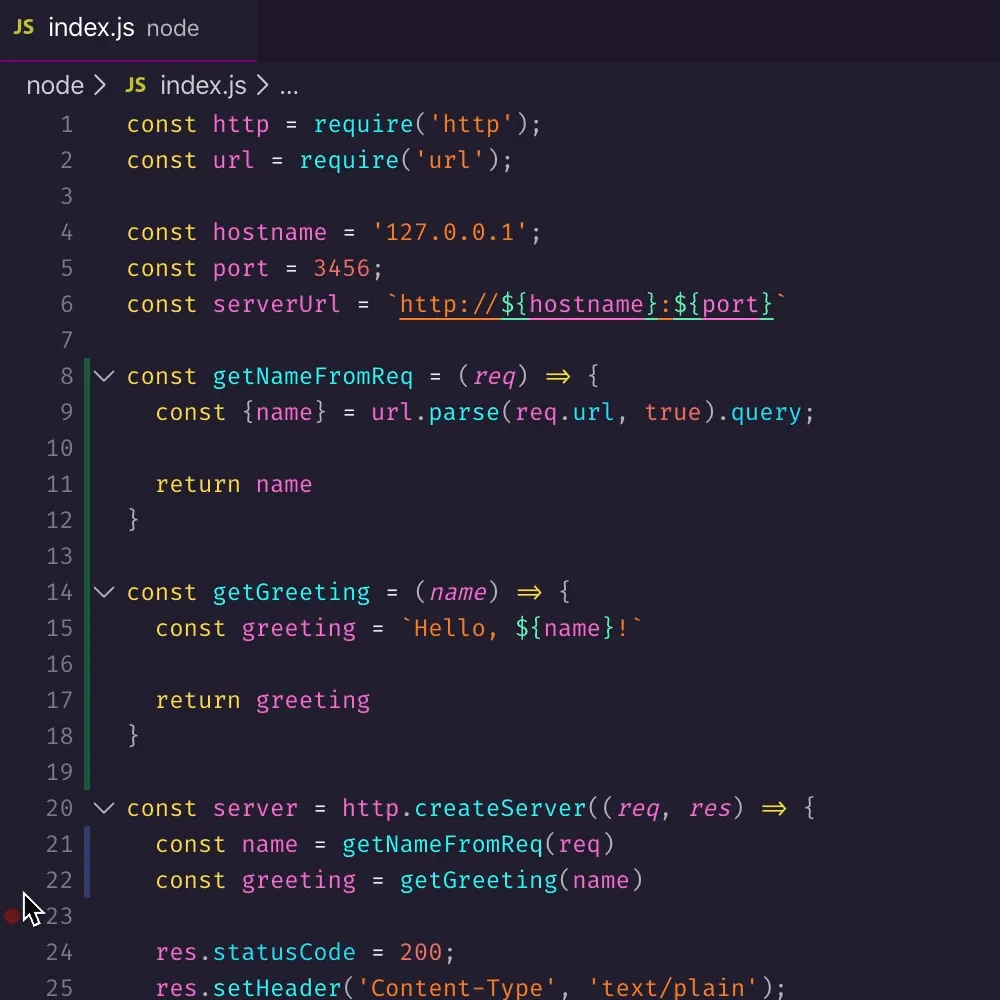
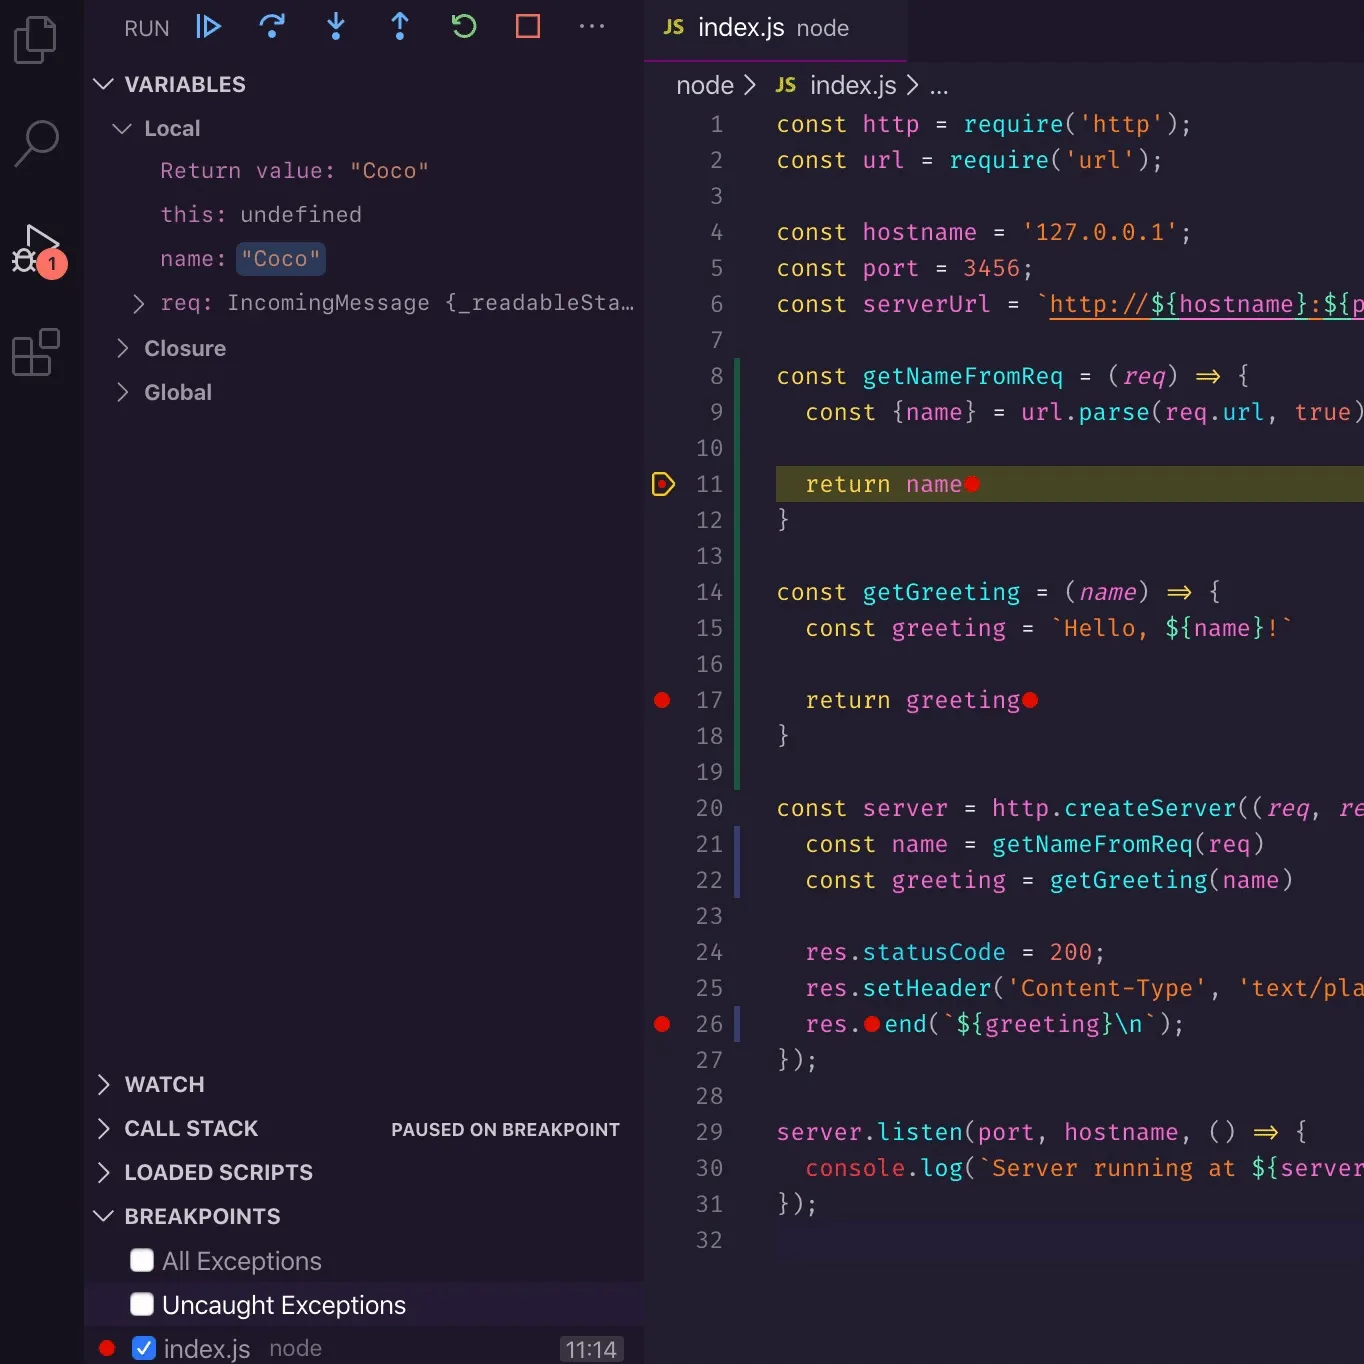
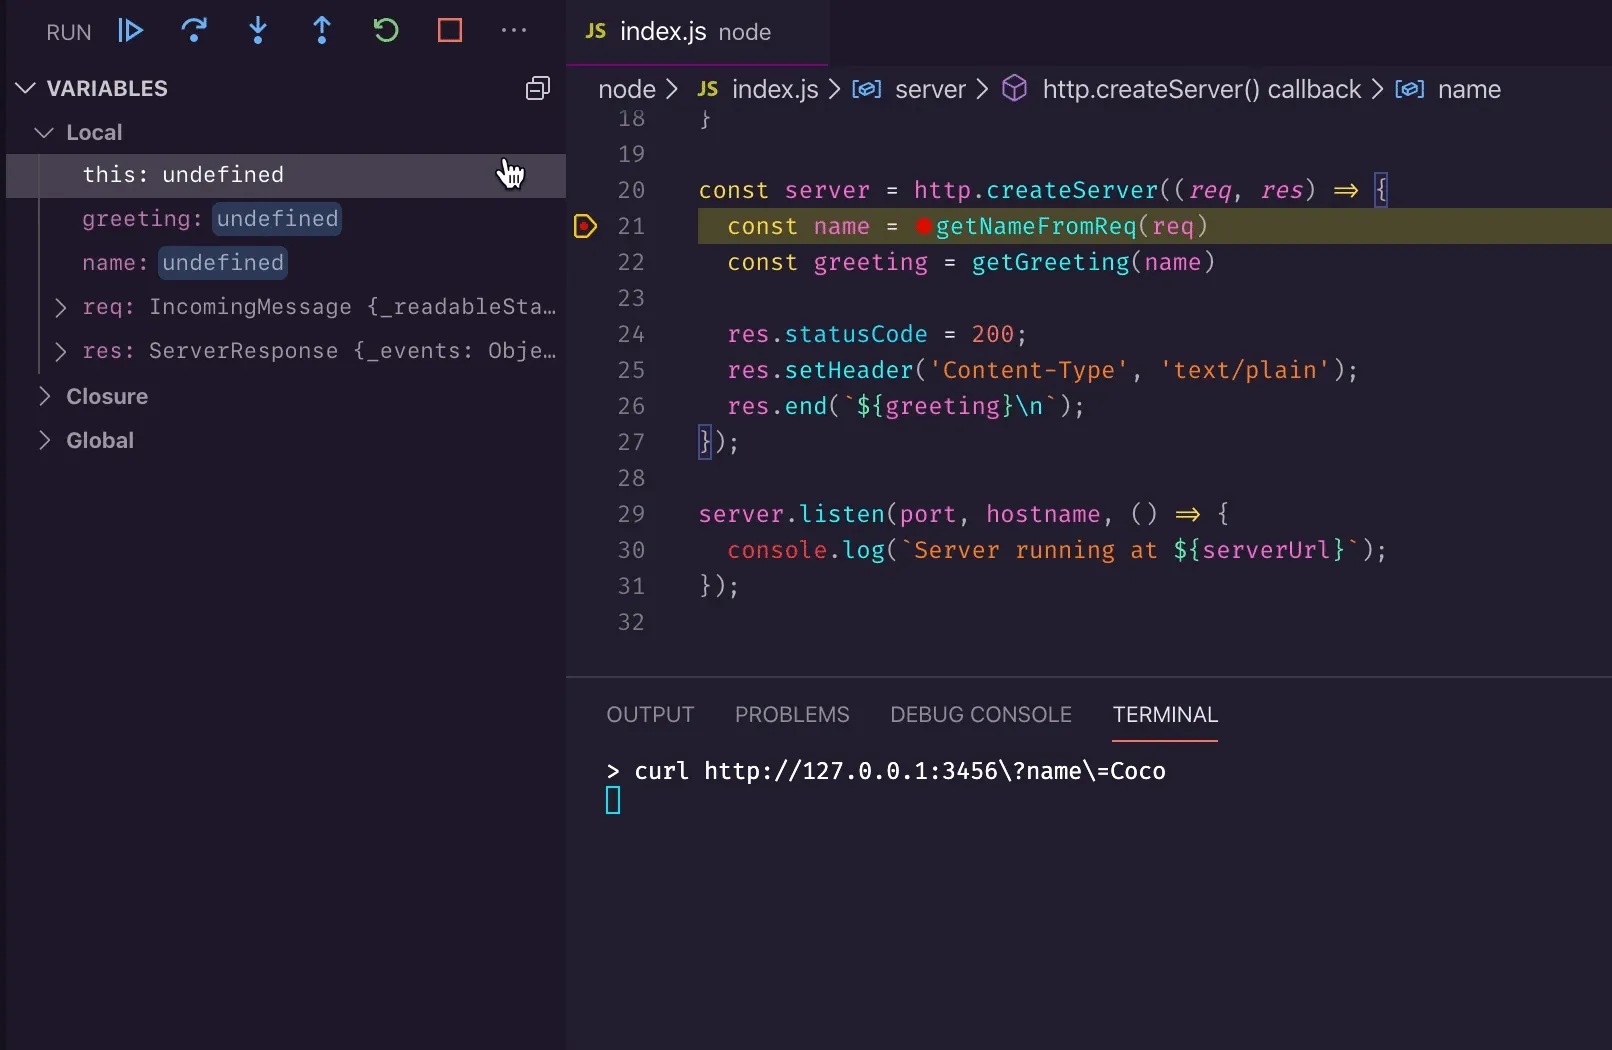
You should have a breakpoint now on line 21:
const name = getNameFromReq(req)Step by Step
Fire off a request again to http://127.0.0.1:3456/?name=Coco - the debugger will kick in and stop code execution on line 21:
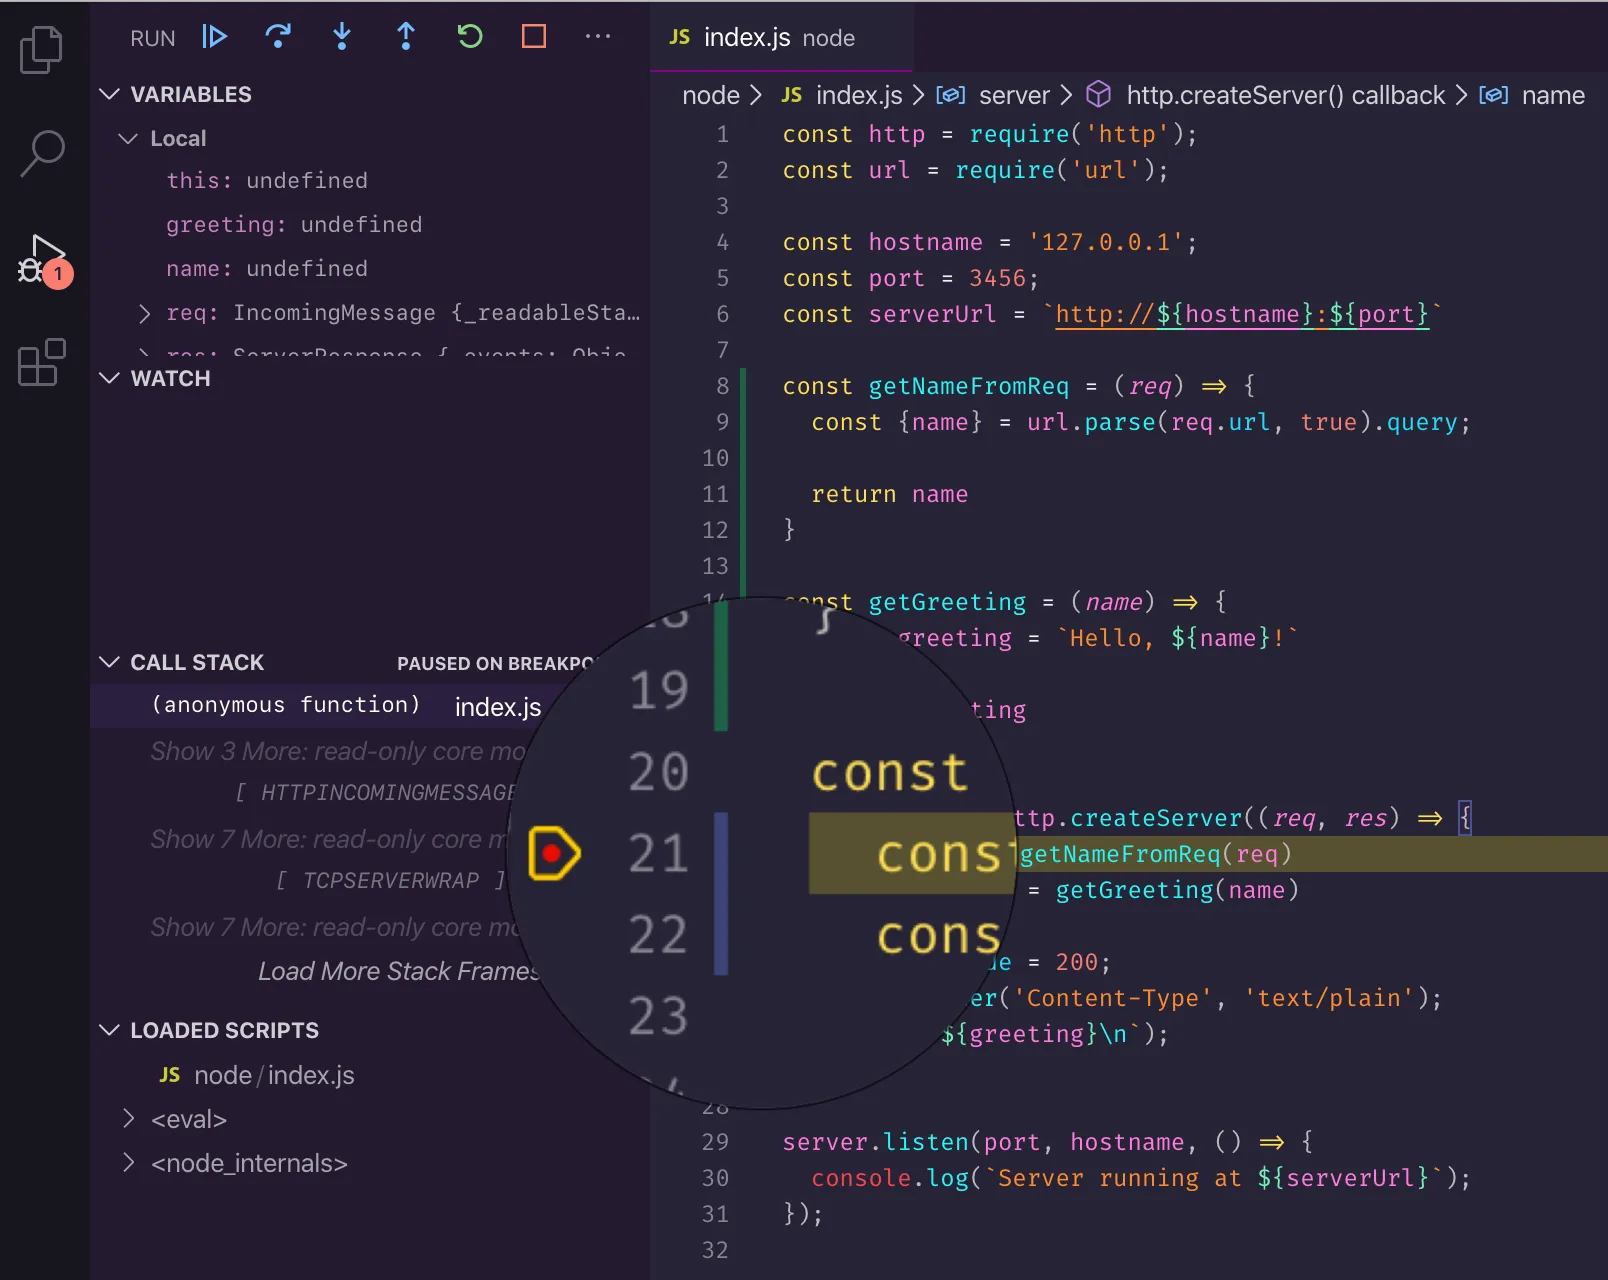
Wonderful. Let’s focus on the debug toolbar now:
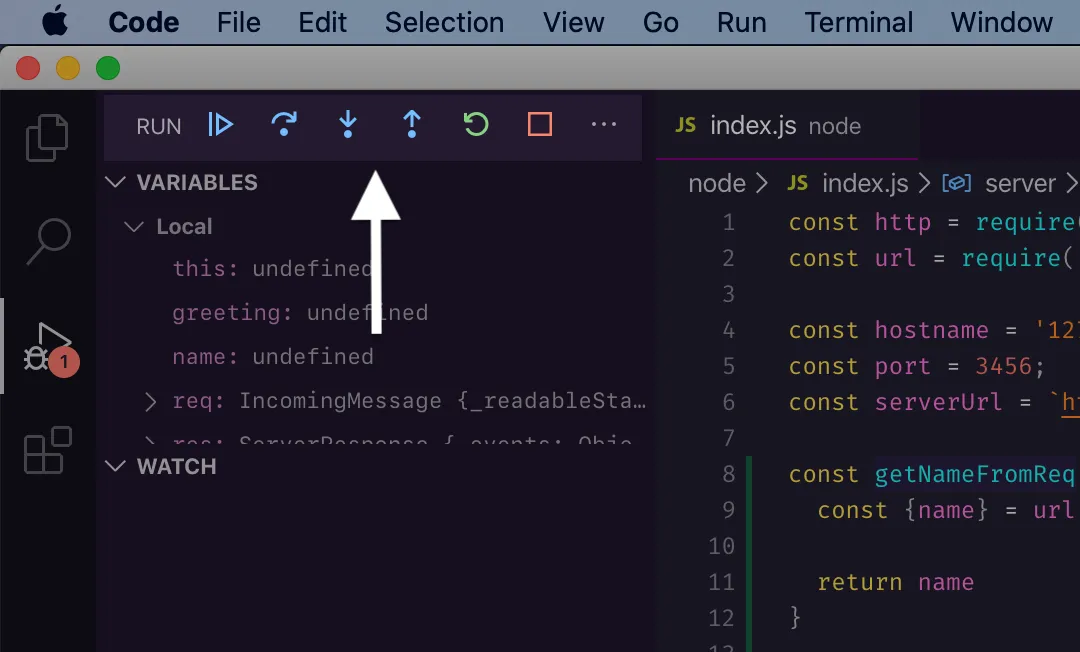
First of all: names. The buttons from left to right are the following (with the default VS Code shortcut):
- Continue / Pause
F5 - Step Over
F10 - Step Into
F11 - Step Out
⇧F11 - Restart
⇧⌘F5 - Stop
⇧F5
Continue, restart and stop are straightforward and will do what you expect: continue to the next breakpoint, restart the process and stop the process (and the debugger).
Steps are related to function calls on the current line: you can step over a function call, step into it (look inside and debug) or leave it (step out). Step-over also allows you to run the code line by line, even if the line is not a function call.
Step commands only control what you “see” in the debugger. So “stepping out” or “over” a function will still execute all the code as usual. The debugger will just not bore you with the details, and you’ll get jor job done quicker.
Continue
Continue will run the code up to the next breakpoint, or the end of the program. One way of debugging is to add multiple breakpoints on relevant lines beforehand and jump between them using continue:
So, Continue is handy if you already know which functions or lines are relevant to you. The debugger will pause at pre-defined locations allowing you to inspect the variables and call stack.
Step Over
You can think of step over as going line-by-line in a function but not following function calls (not stepping in). Use it if you’re not interested in the details of the function call on the current line, but only want to see how local variables change over time, for example:
Step over is a great way to walk trough devlarative code.
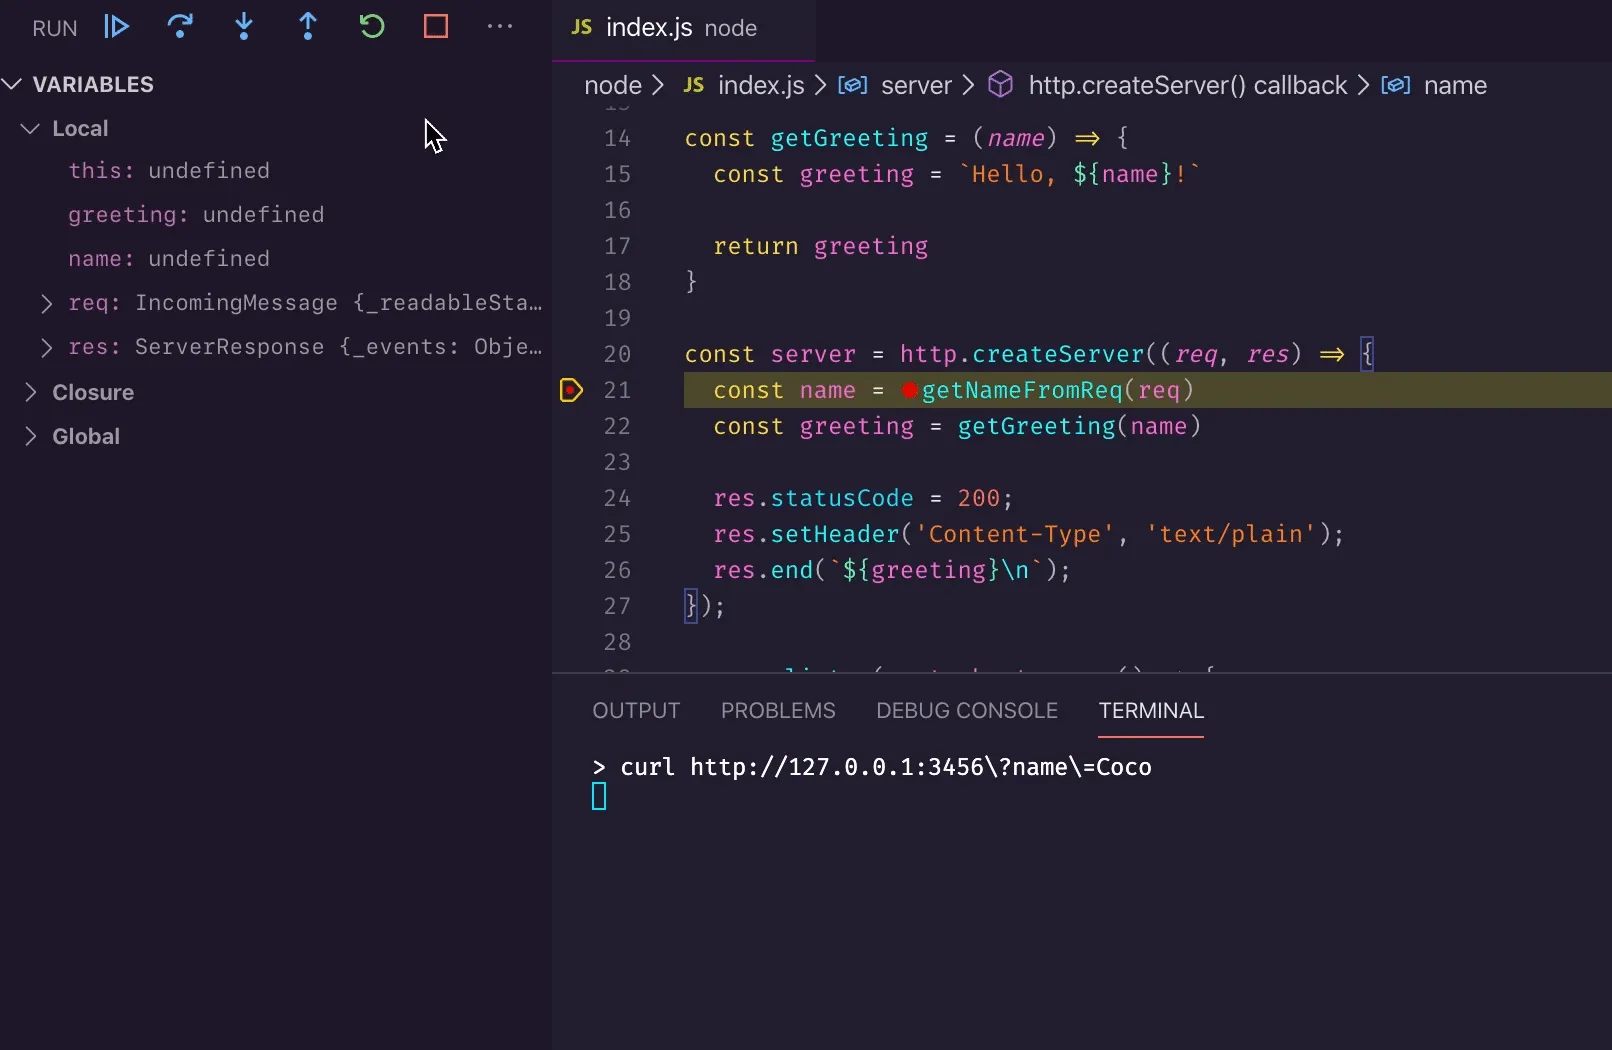
Step Into
You can use step-into when you arrive on a line that calls an interesting function, and you want to dig deeper. Once you step into a block, you keep debugging as usual (use continue, step commands, etc.).
Observe how we step over getNameFromReq but step into getGreeting:
Step Out
Stepping out is the opposite of stepping in: you can leave a function once you’re no longer interested in it. Clicking “Step out” runs the remaining code of the function without you having to keep clicking.
Check out the difference between debugging the two functions - we follow the first one through but step out of the second early:
Now you should have a better understanding of the debugger toolbar, how to focus on what matters and skip the irrelevant bits. The navigation commands not only save you time but make the whole debugging activity more enjoyable! Why not try these in your project as an exercise?
Happy debugging! 🥼