Code setup
To speed things up, I’ve prepared a simple React app we can play with here, so all you need to do is to check out the repo for this series and start the CRA dev server:
git clone git@github.com:thekarel/debug-anything.git
cd debug-anything/react-cra
yarn # npm i
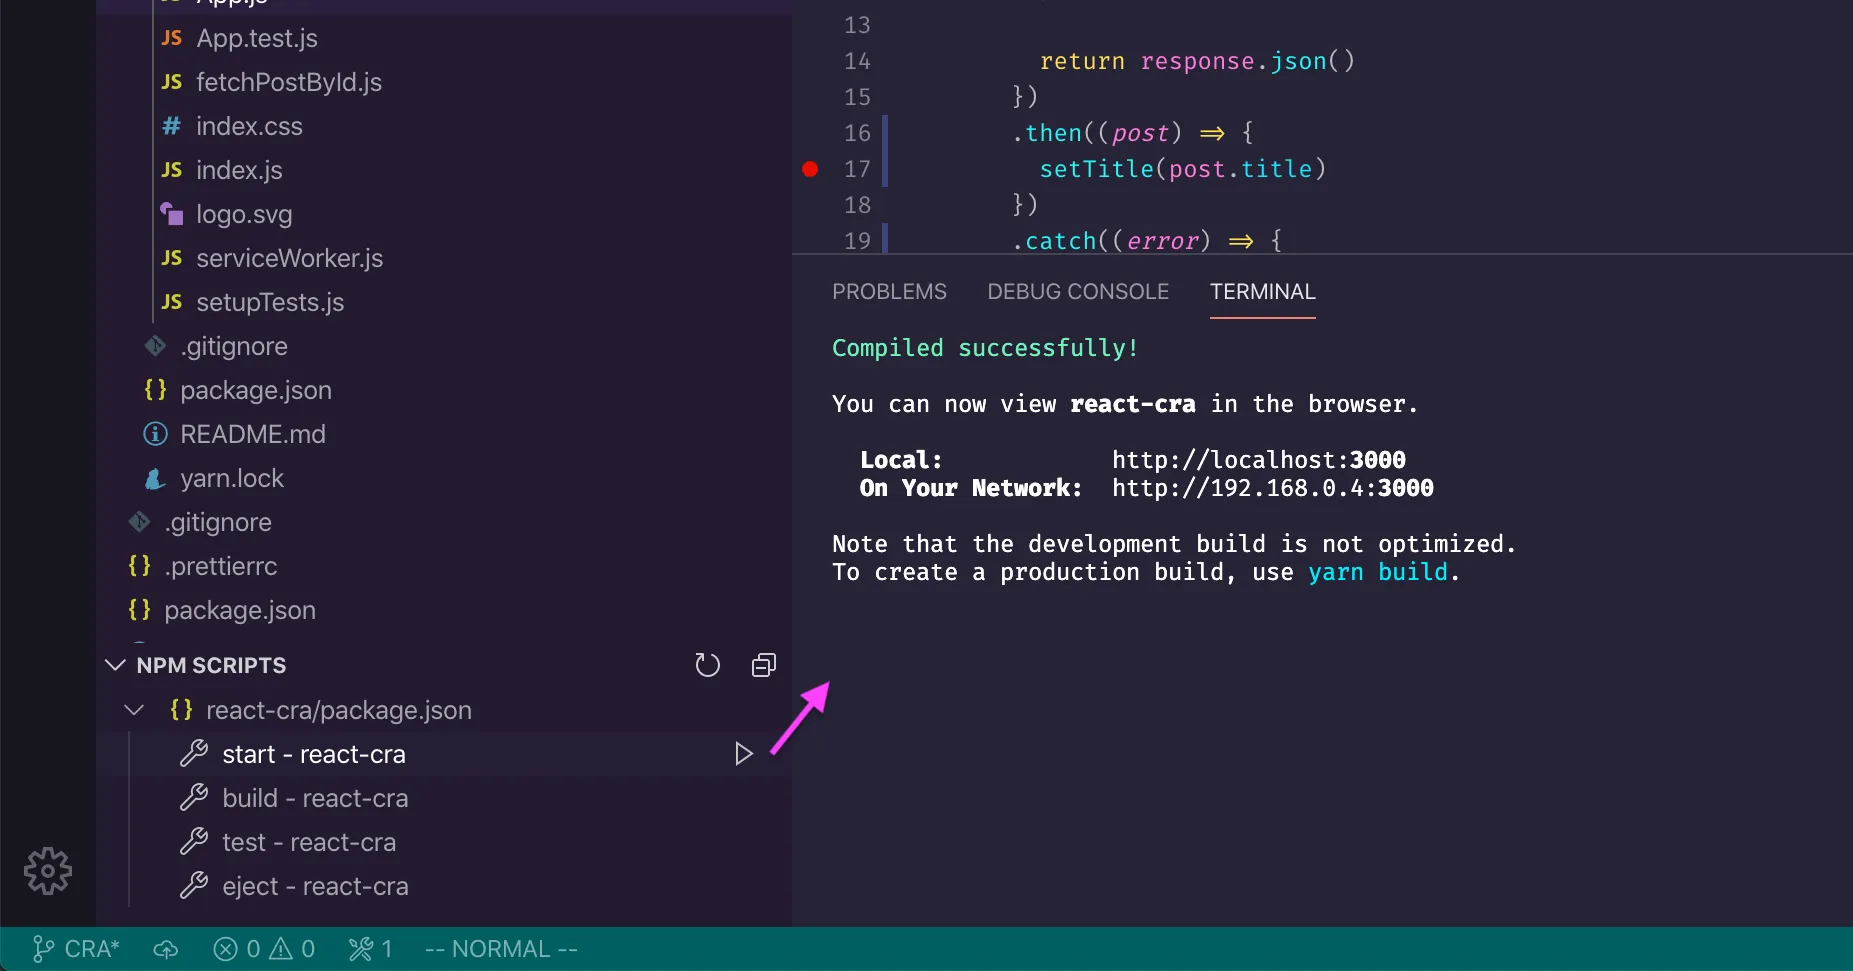
yarn start # npm startYou should see a successful launch message in your console:
Compiled successfully!

You can now view react-cra in the browser.

  Local:            http://localhost:3000
  On Your Network:  http://192.168.0.4:3000

Note that the development build is not optimized.
To create a production build, use yarn build.
Creating a launch.json
As discussed before, we need a launch.json for non-trivial use cases - see Debug anything: launch.json & the debug console for more details.
The sample code already contains the launch configuration too. It’s pretty straightforward, but let’s walk through it line by line, to make sure we understand what’s happening. Open .vscode/launch.json:
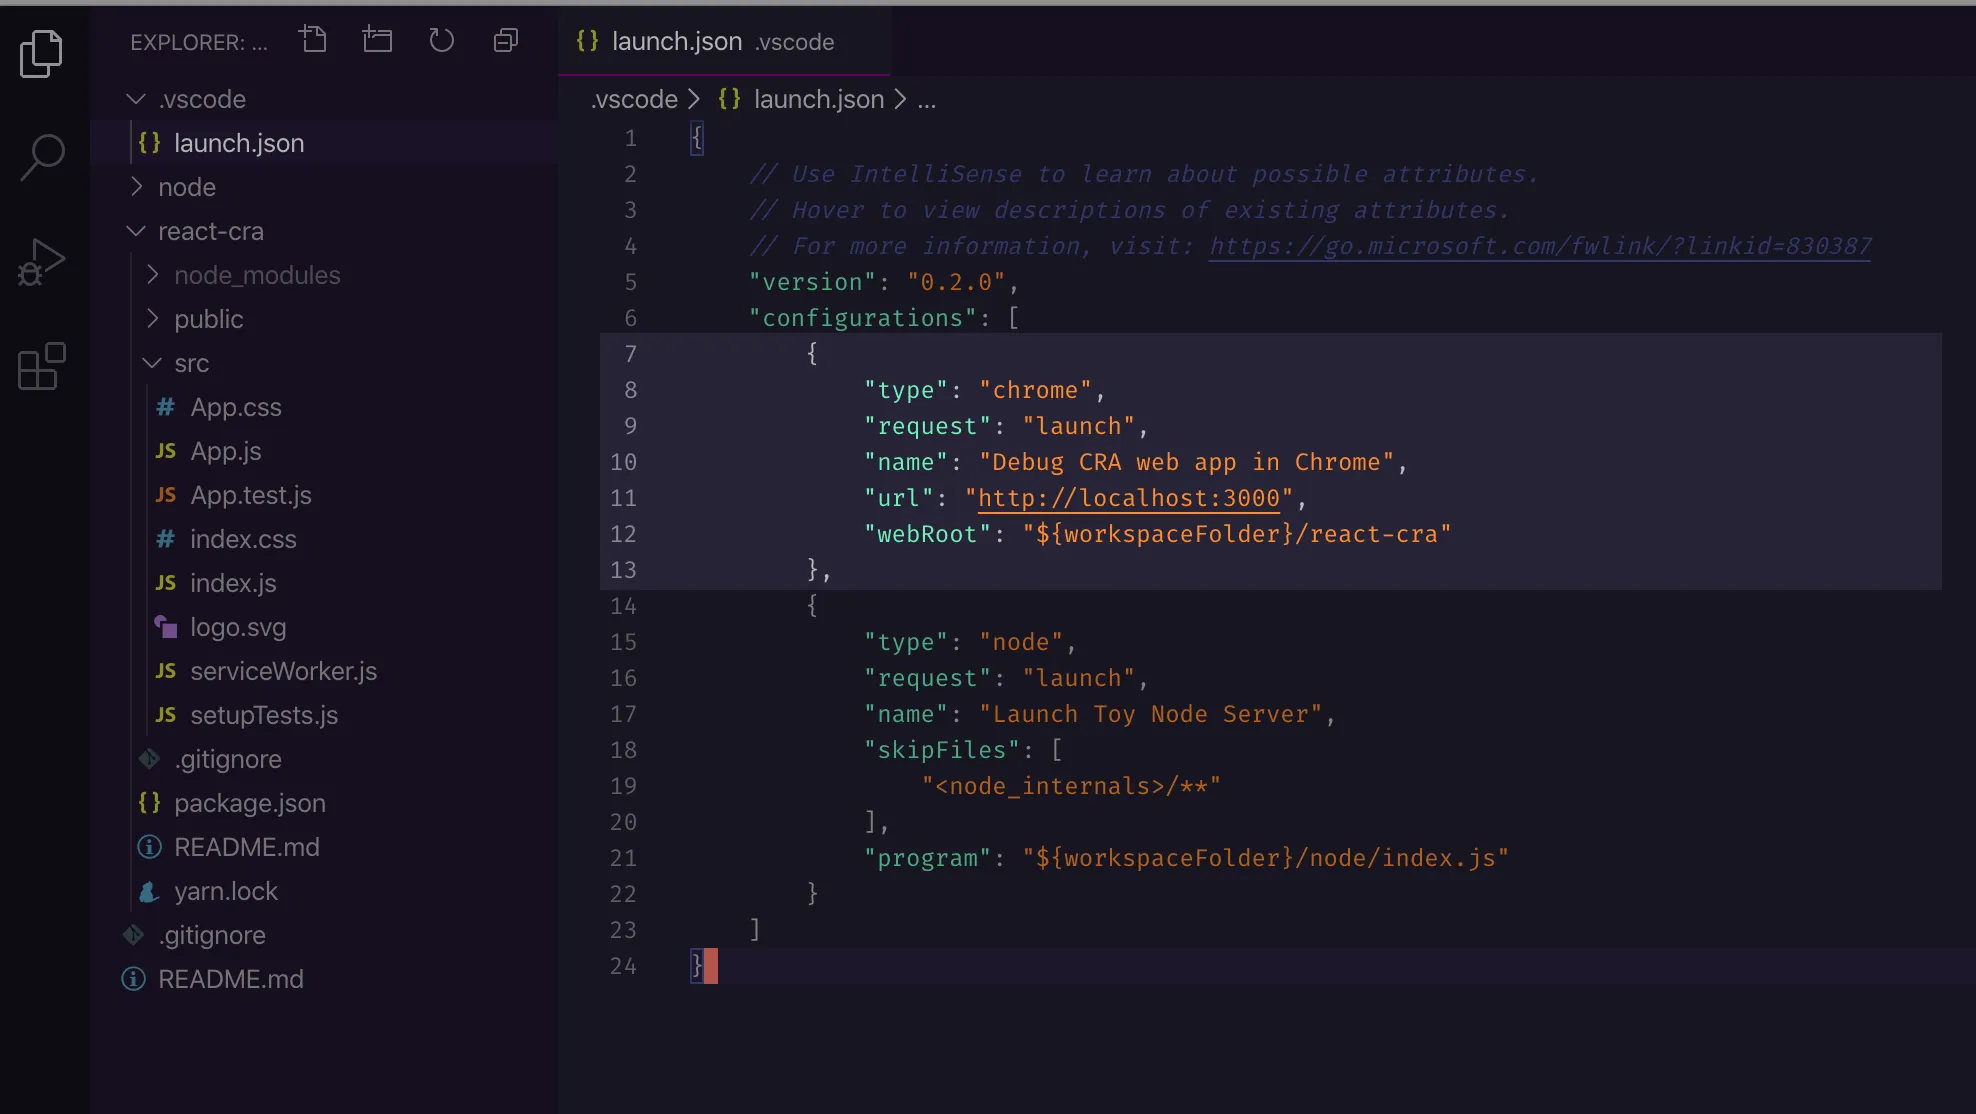
Let’s focus on lines 8 to 12 and go from top to bottom:
{
    "type": "chrome",
    "request": "launch",
    "name": "Debug CRA web app in Chrome",
    "url": "http://localhost:3000",
    "webRoot": "${workspaceFolder}/react-cra"
}type: this sets the debugger type to chrome, meaning we’ll use Chrome browser in this config. Another type we’ve before used is node - there are many others you can get by installing extensions. There’s one for Firefox too 🦊
Each debugger
typehas its specific configuration, so try to use the handy autocomplete that comes with VS Code.
request: the selected option launch means we’ll launch a browser for debugging and it will load the address specified below. It’s not very different from what you’d do manually, but Code automates it for you. Another possibility is to attach to an already running debug server, which is not possible here. It’s good to know that VS Code will take care of closing Chrome when you stop the debug session.
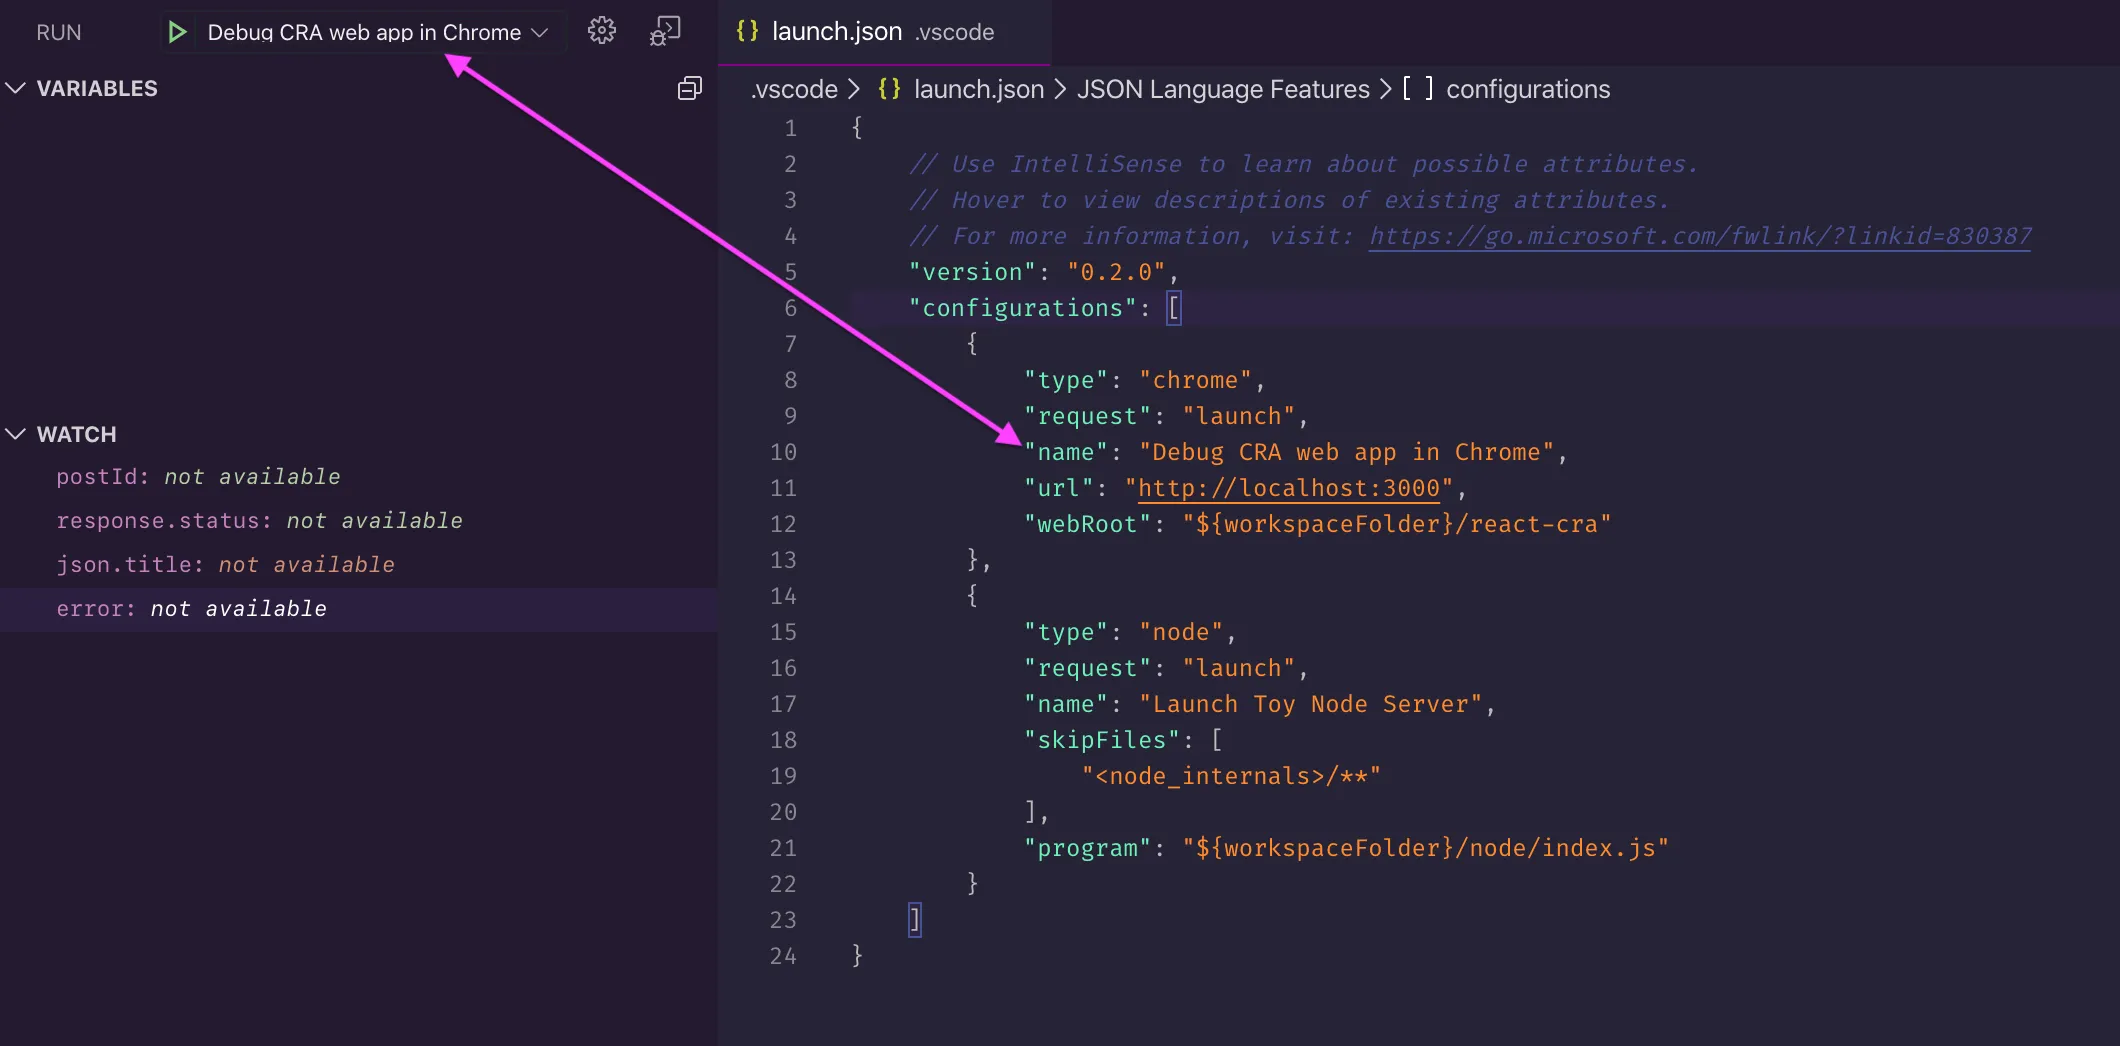
name: any name you prefer, this will show up in the debug toolbar:
url: the URL the browser will load - this has to match the one where the CRA dev server is running!
webRoot: the path to the project source files. Source maps are not reliable in CRA development mode, unfortunately.
The CRA debug recipe
So how does all this hang together? The debug process is made up of the following steps.
First, you start the dev server in a console with npm start - this can be done in VS Code too by the way.
Next, you launch the debug browser from the debug sidebar, or by pressing F5:
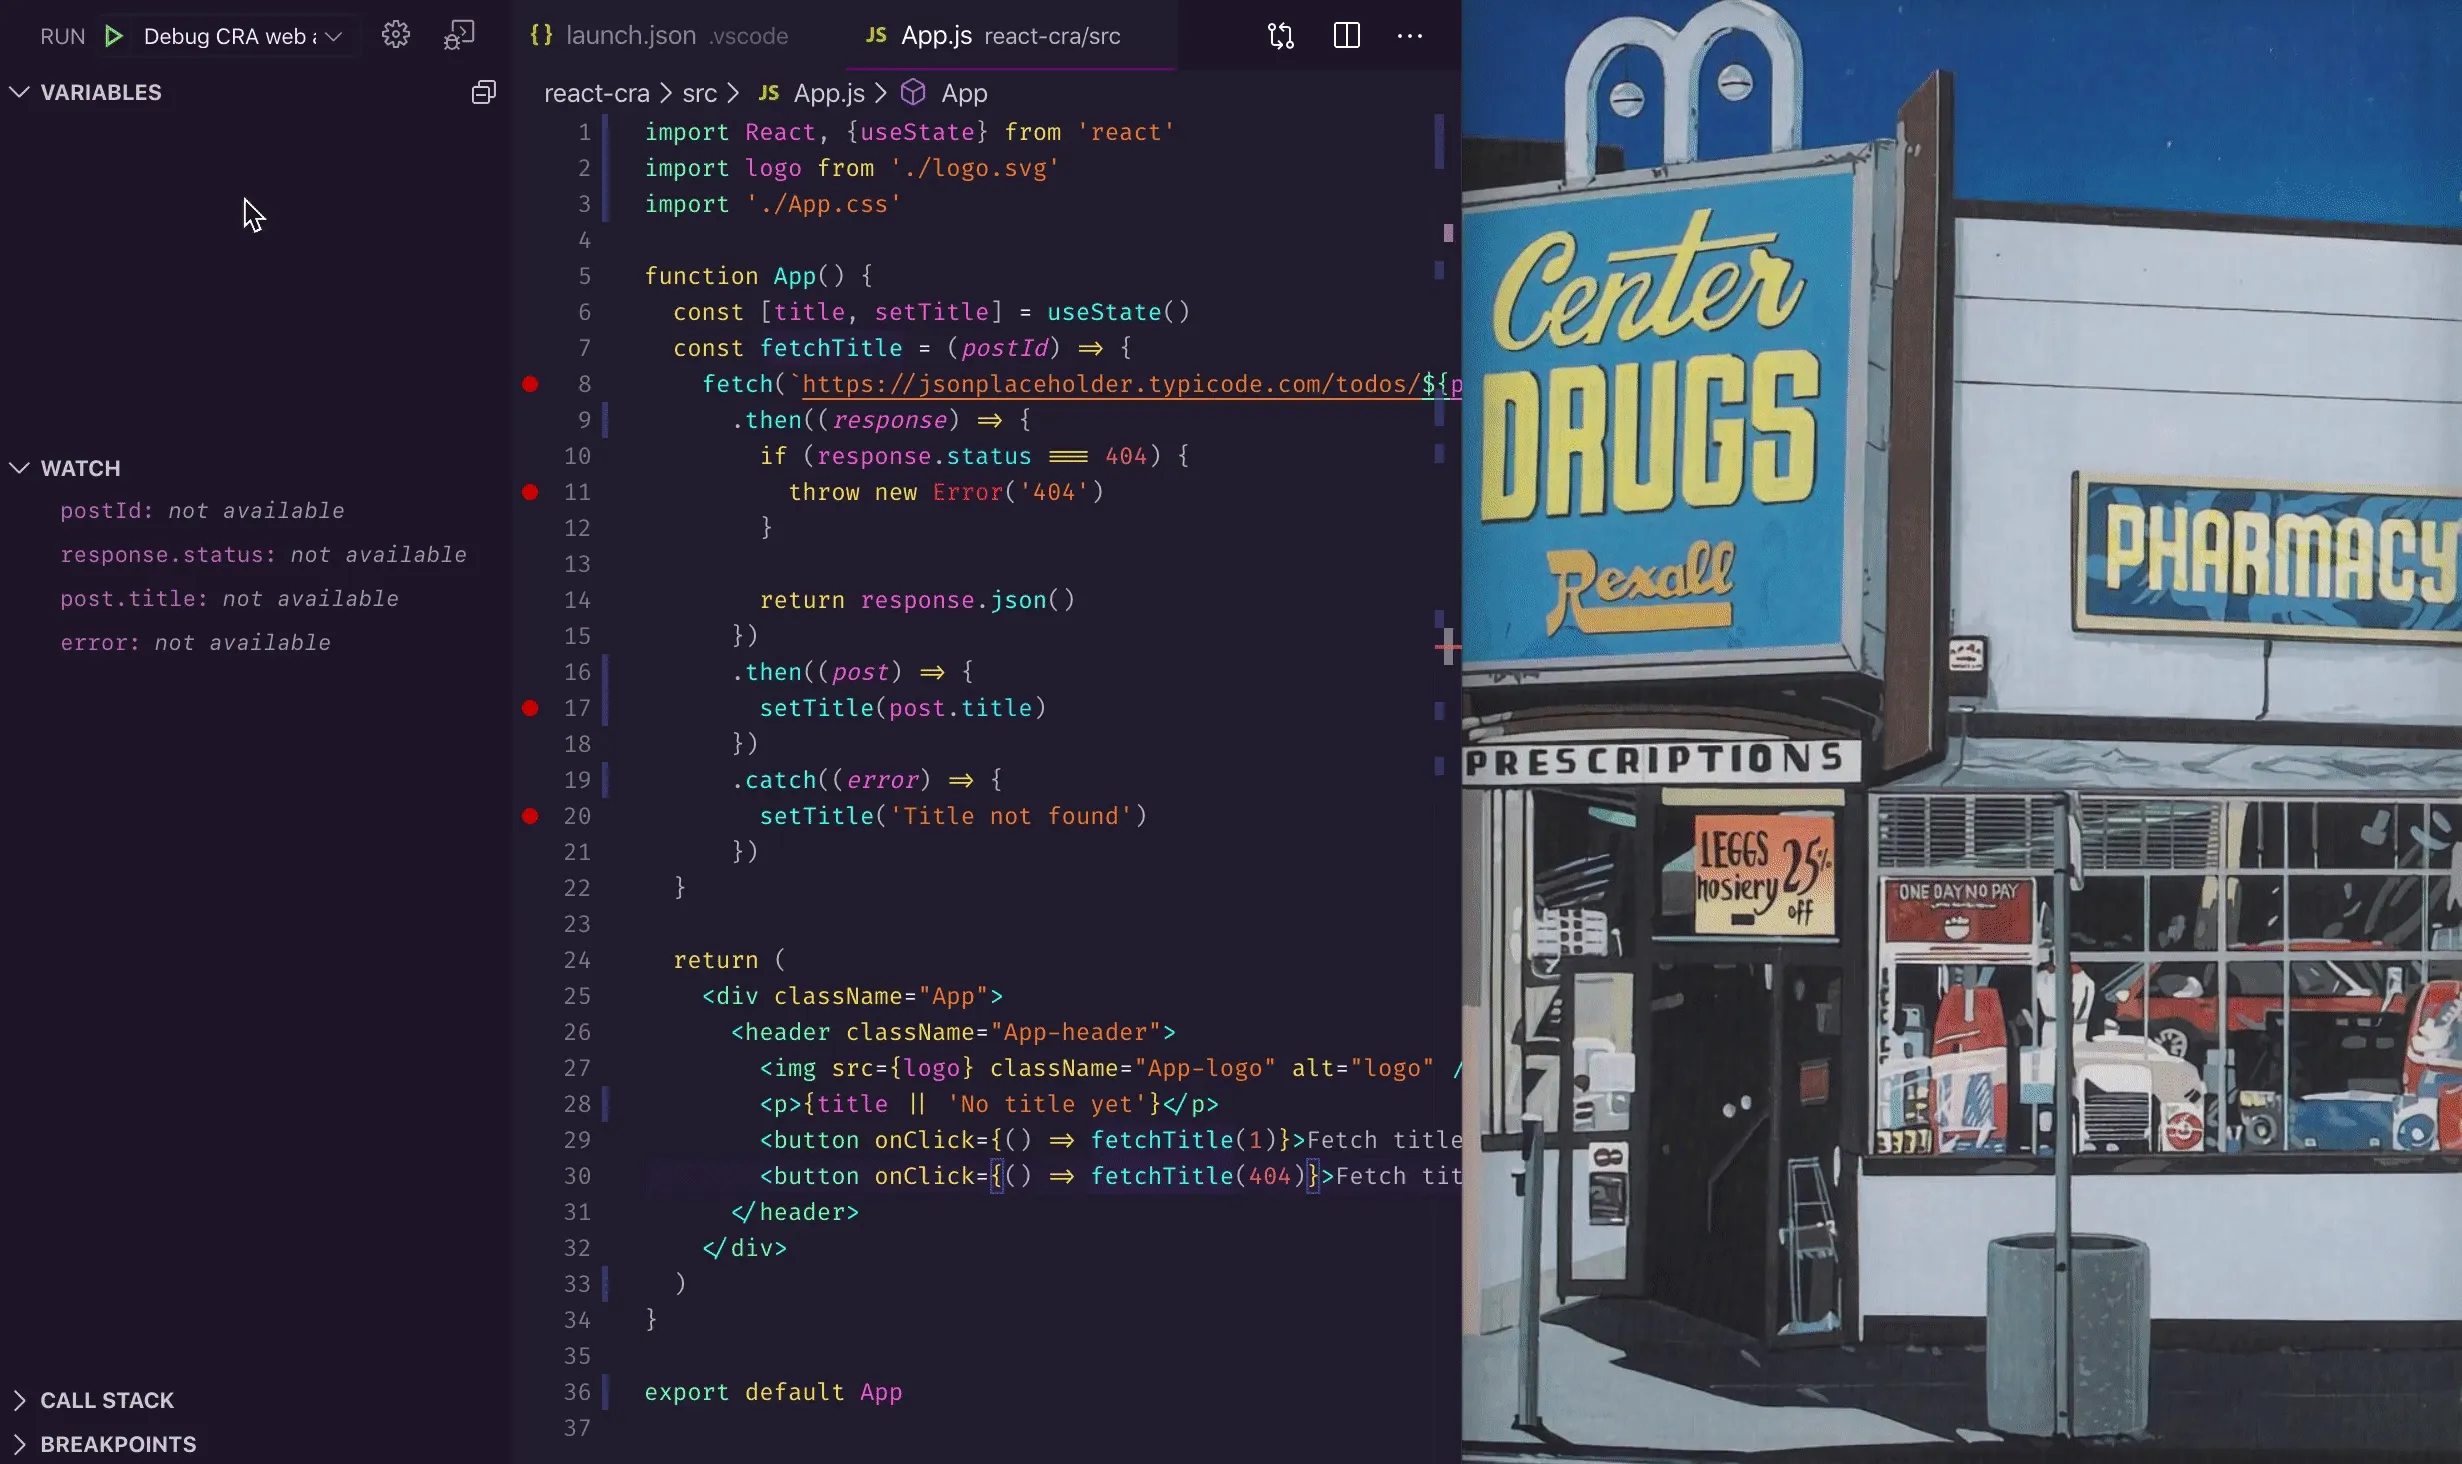
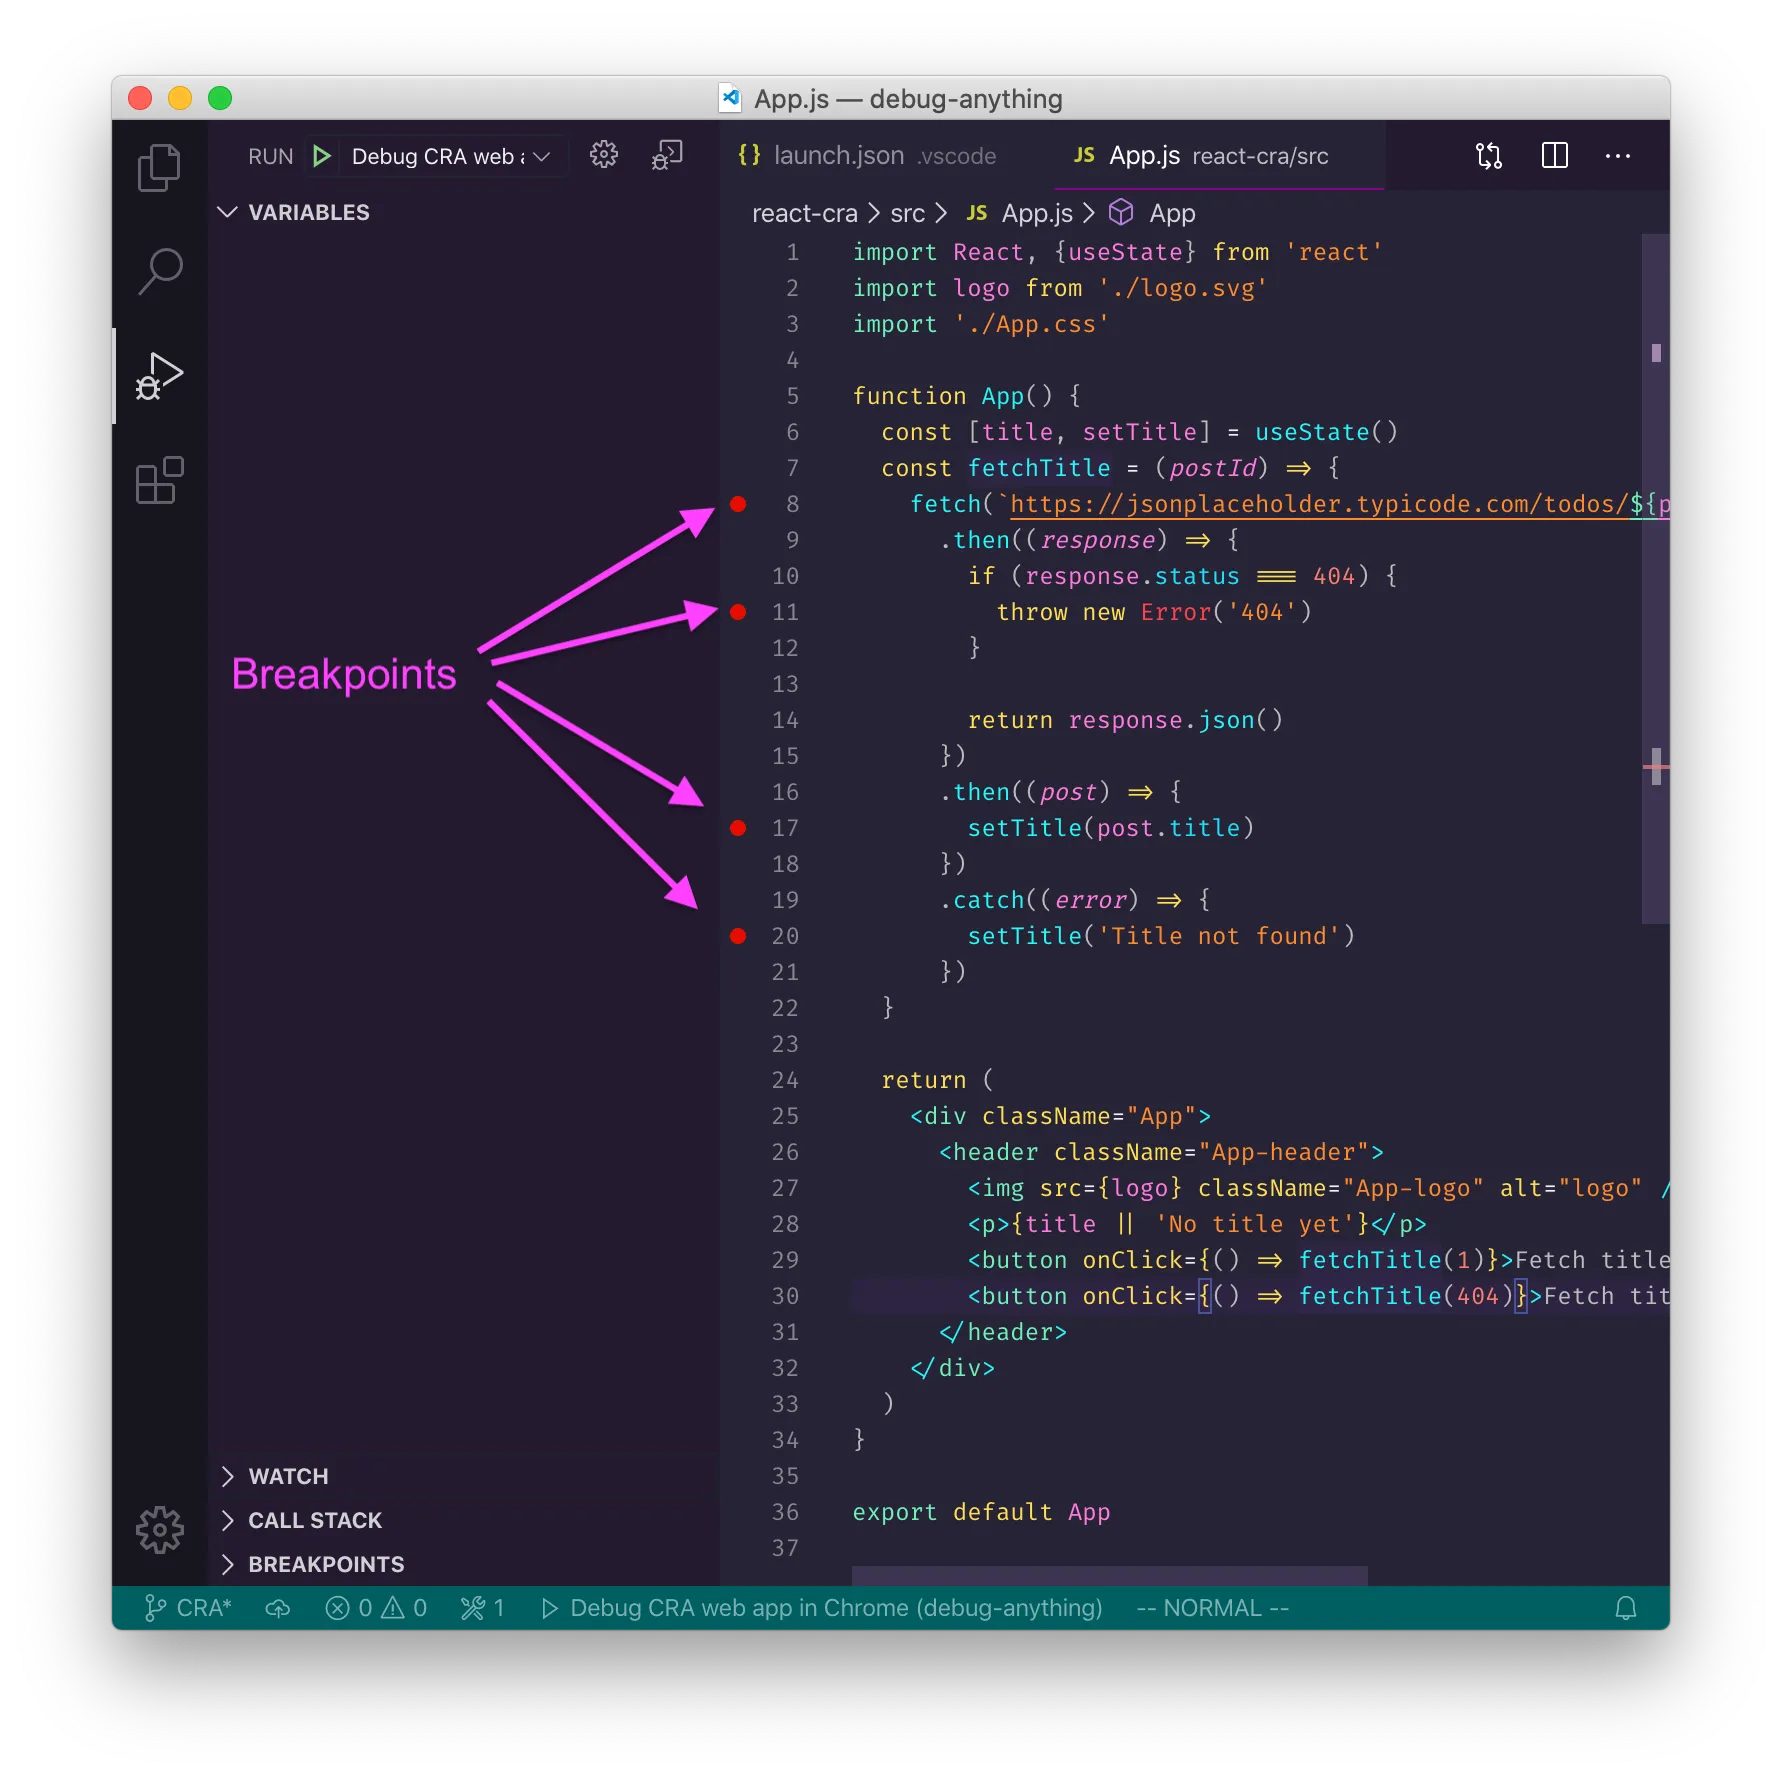
Add breakpoints to your code as usual:
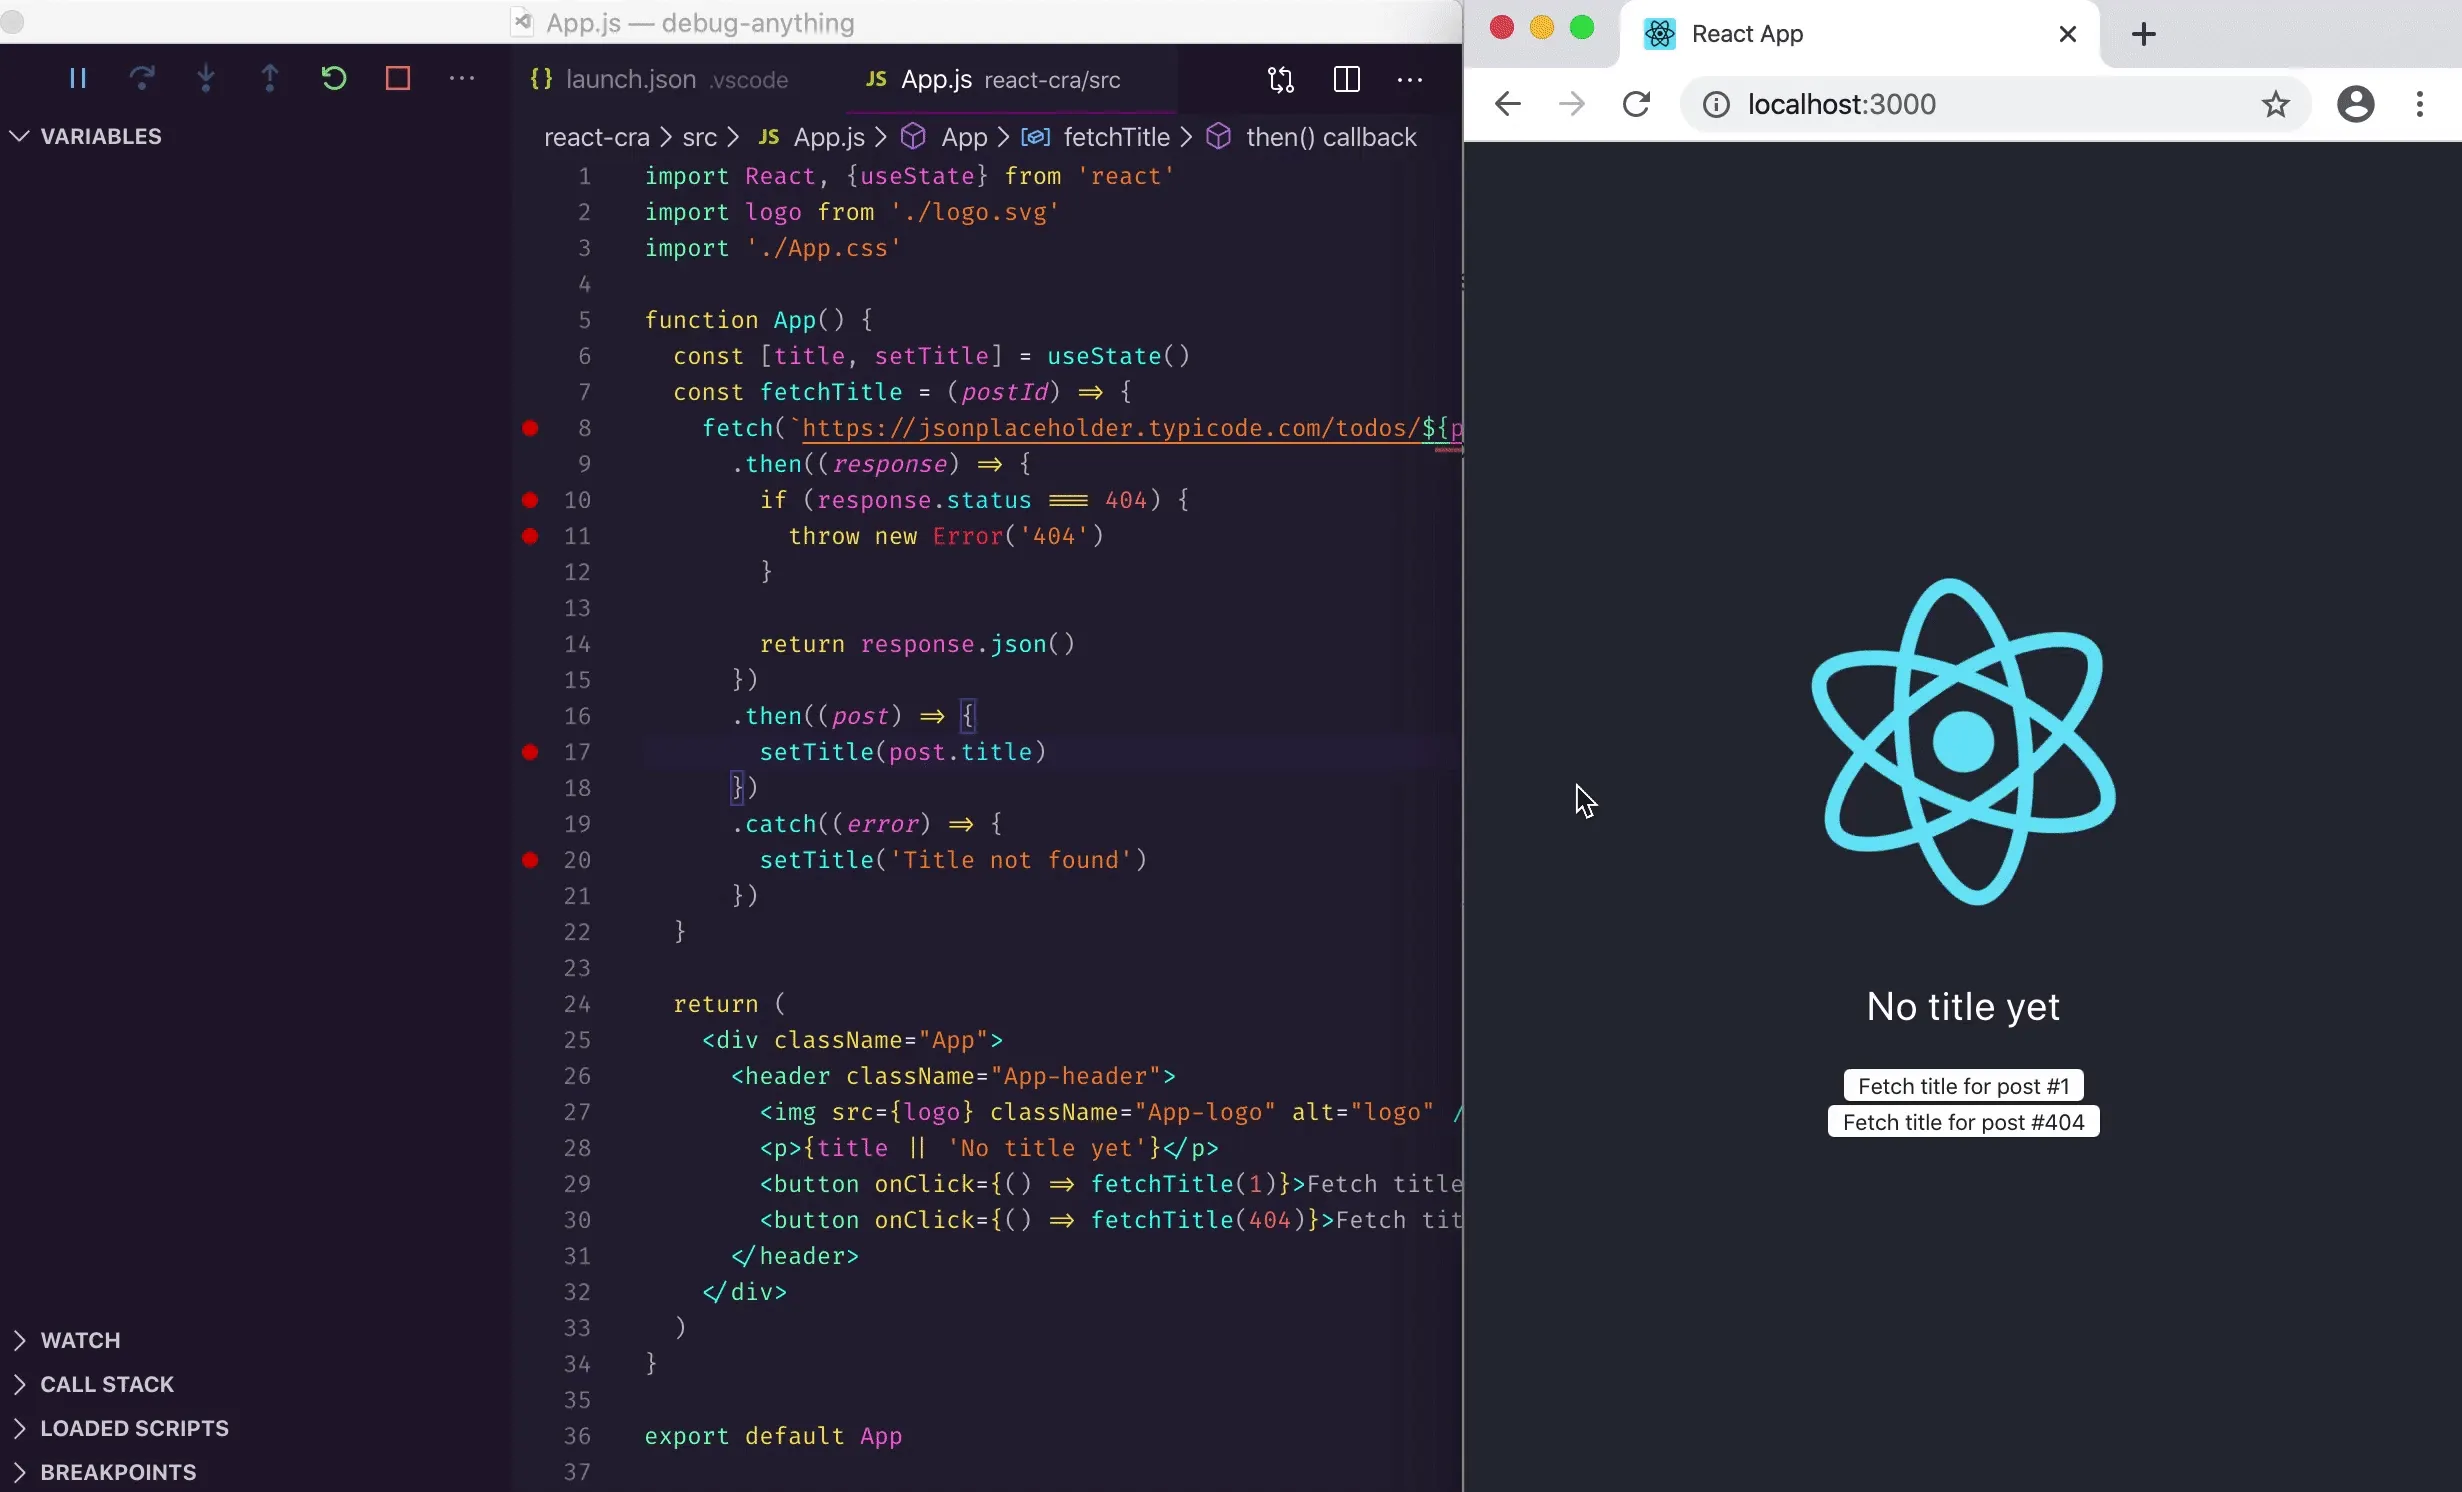
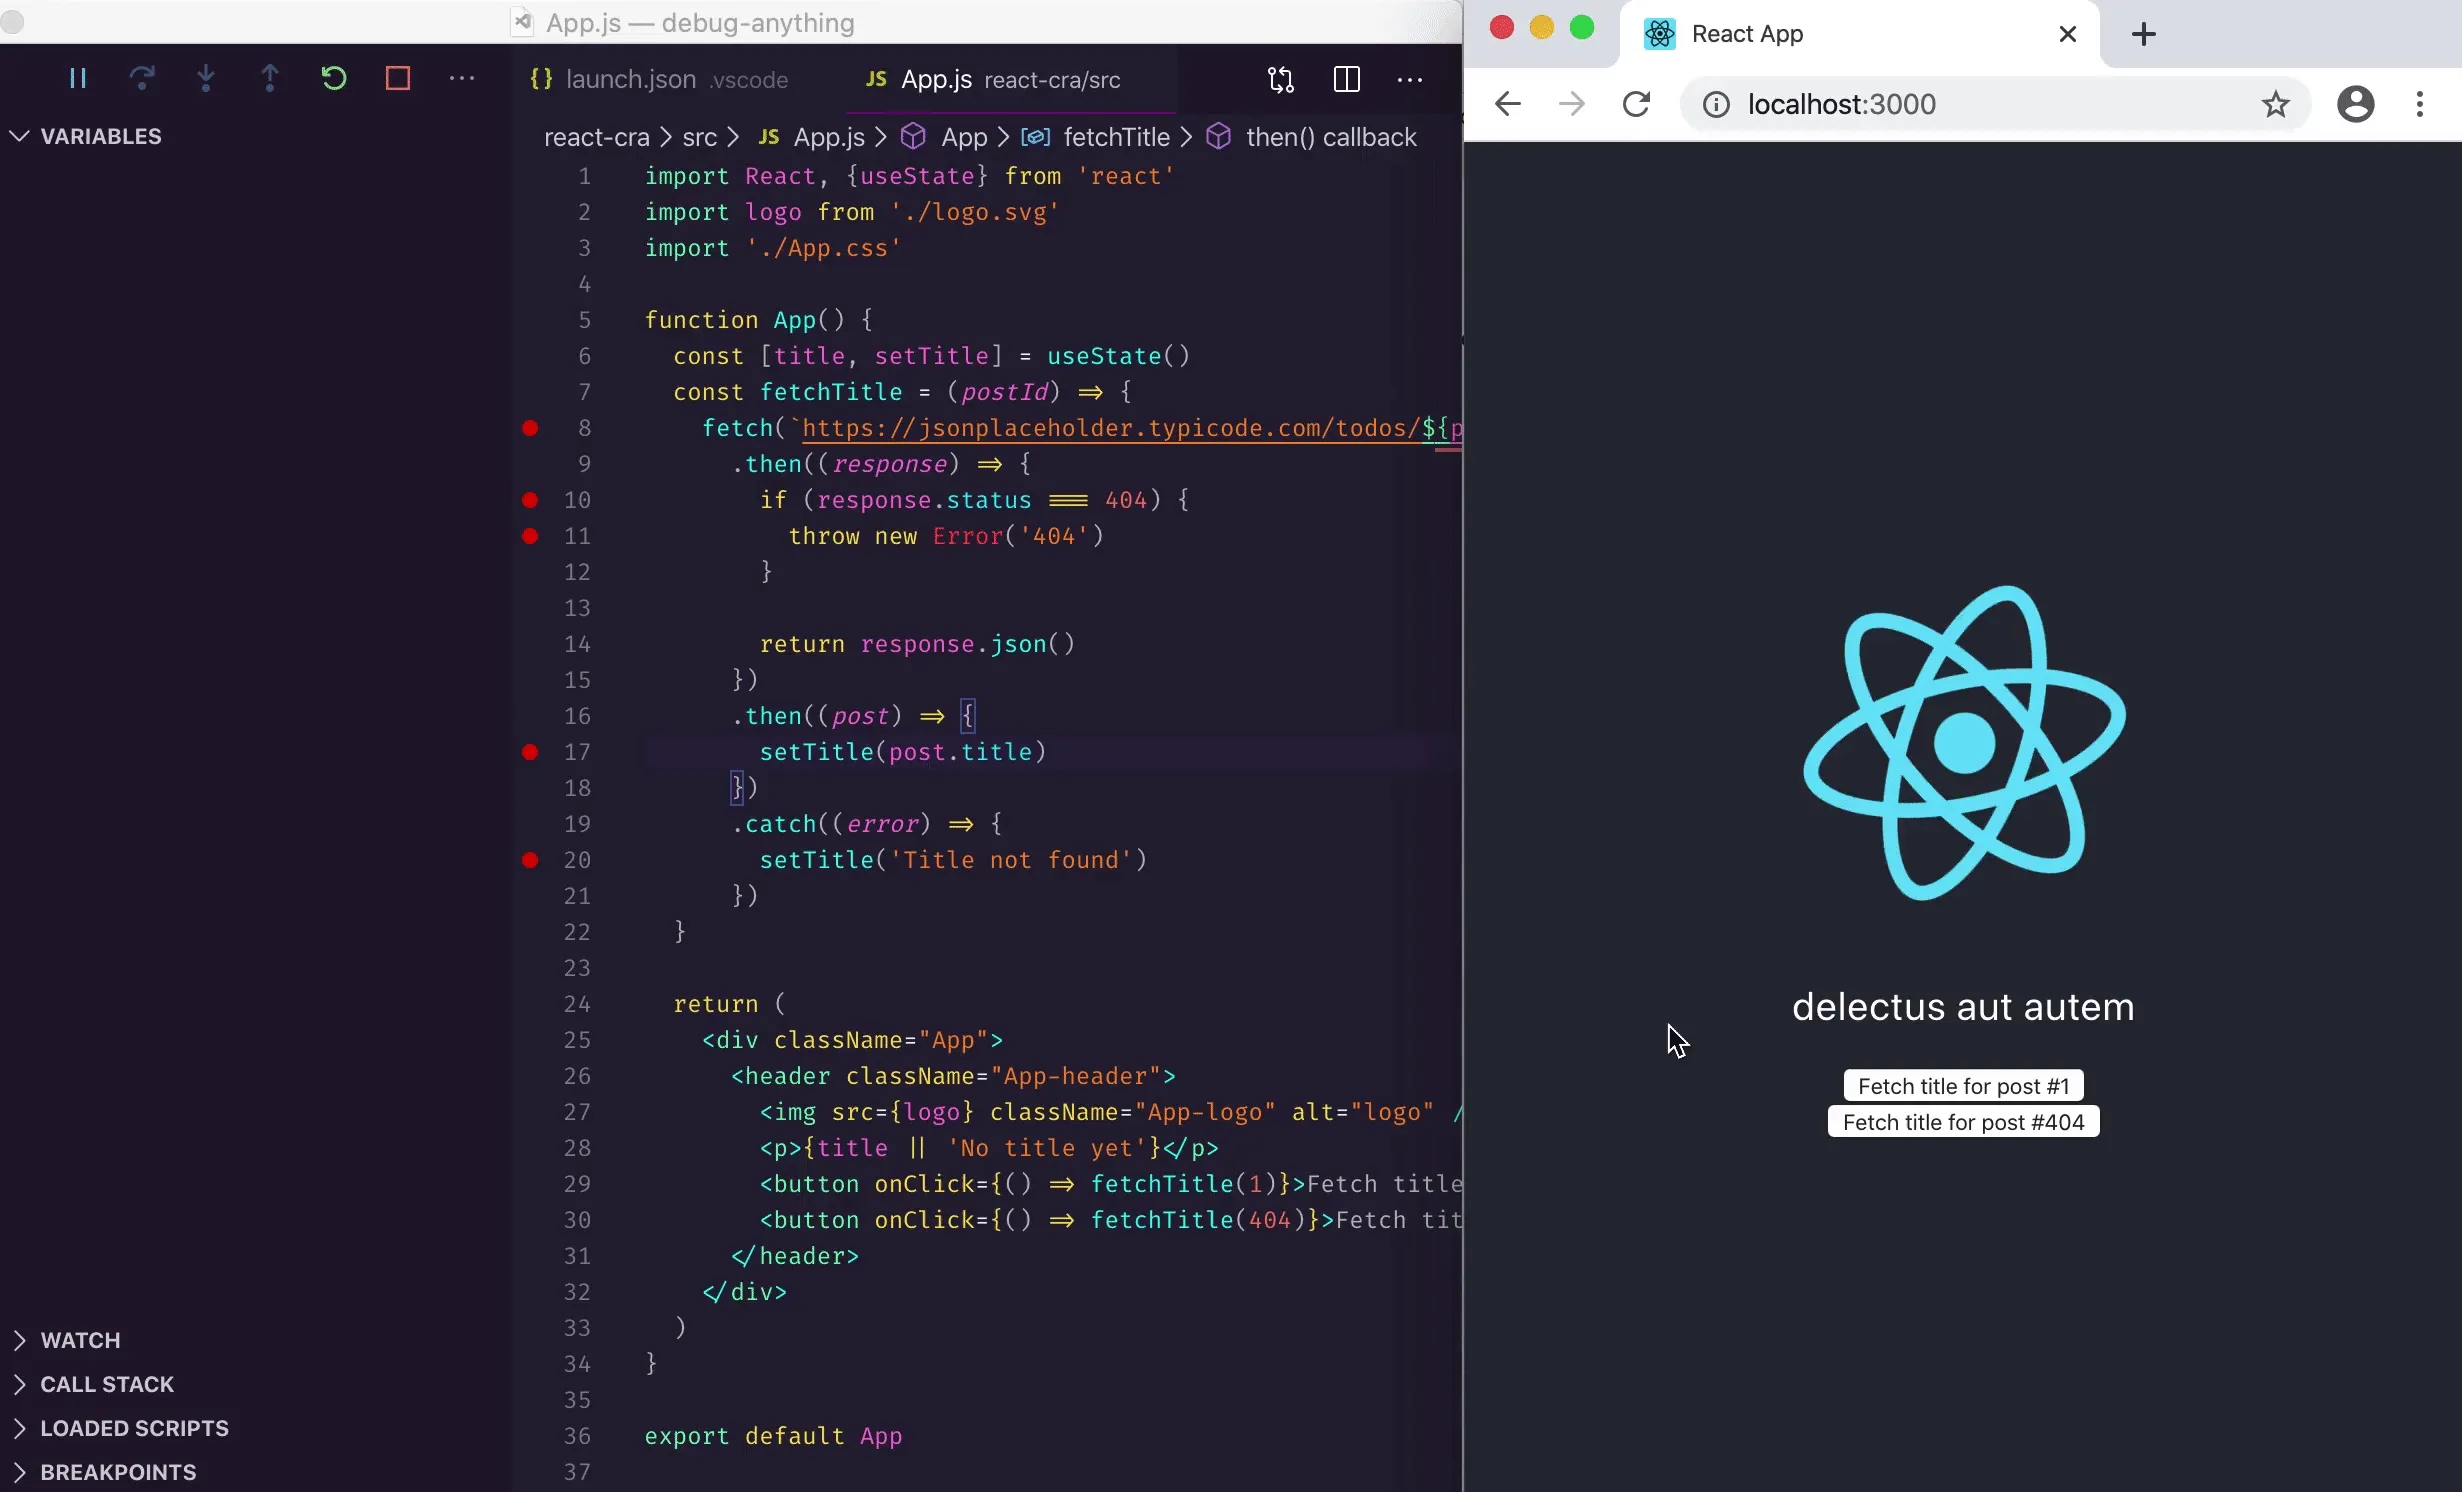
Then interact with the site in the debug browser, but this time with the debug powers enabled 💪 Let’s see how a successful fetch looks like in our sample app:
You can restart the session and bring the app back to its original state by using Restart in the toolbar:
You might be wondering if this is any better than opening the page in a “normal” Chrome and using the dev tools? The difference is not huge in this case. One clear benefit, though, is that you get to keep your breakpoints even after you close the browser or quit Code. This applies to watch expressions too! Speaking of which…
Bonus: adding watch expressions
We’ve seen how to inspect and even edit local variables. Going to the variables section and looking at values works. But if you’re dealing with complex objects, repeatedly opening up nested structures gets annoying fast.
VS Code offers a more comfortable solution: you can set watch expressions that will be re-evaluated in each debug step. It’s even possible to query nested properties with the dot notation (e.g. post.title).
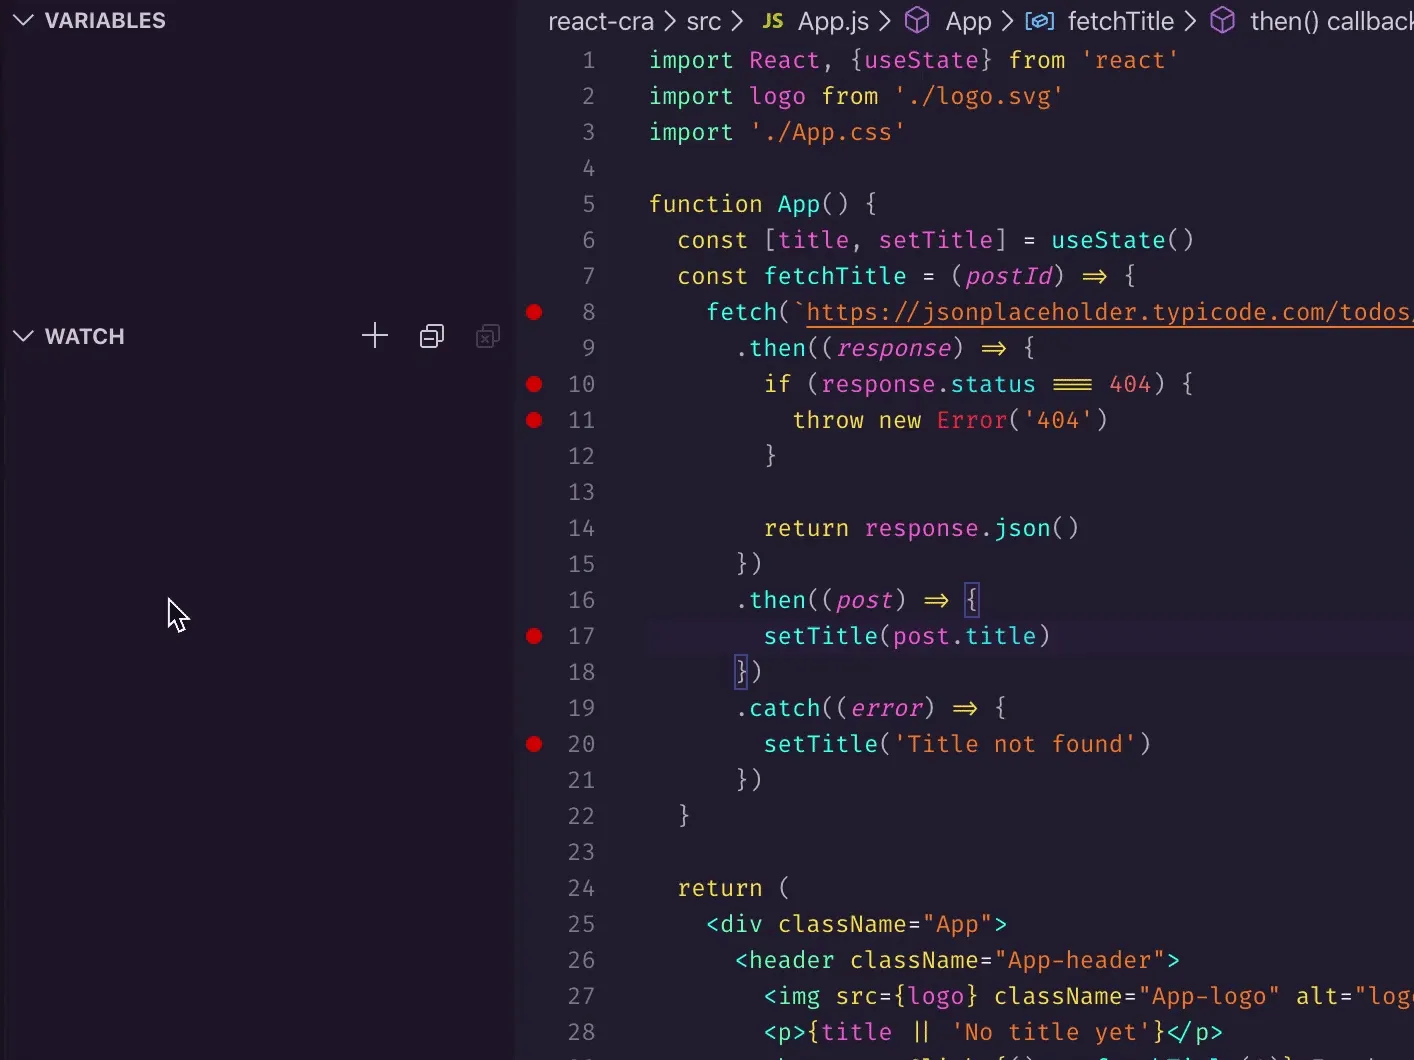
Make sure the Watch section is open in the debug sidebar and add a few expressions:
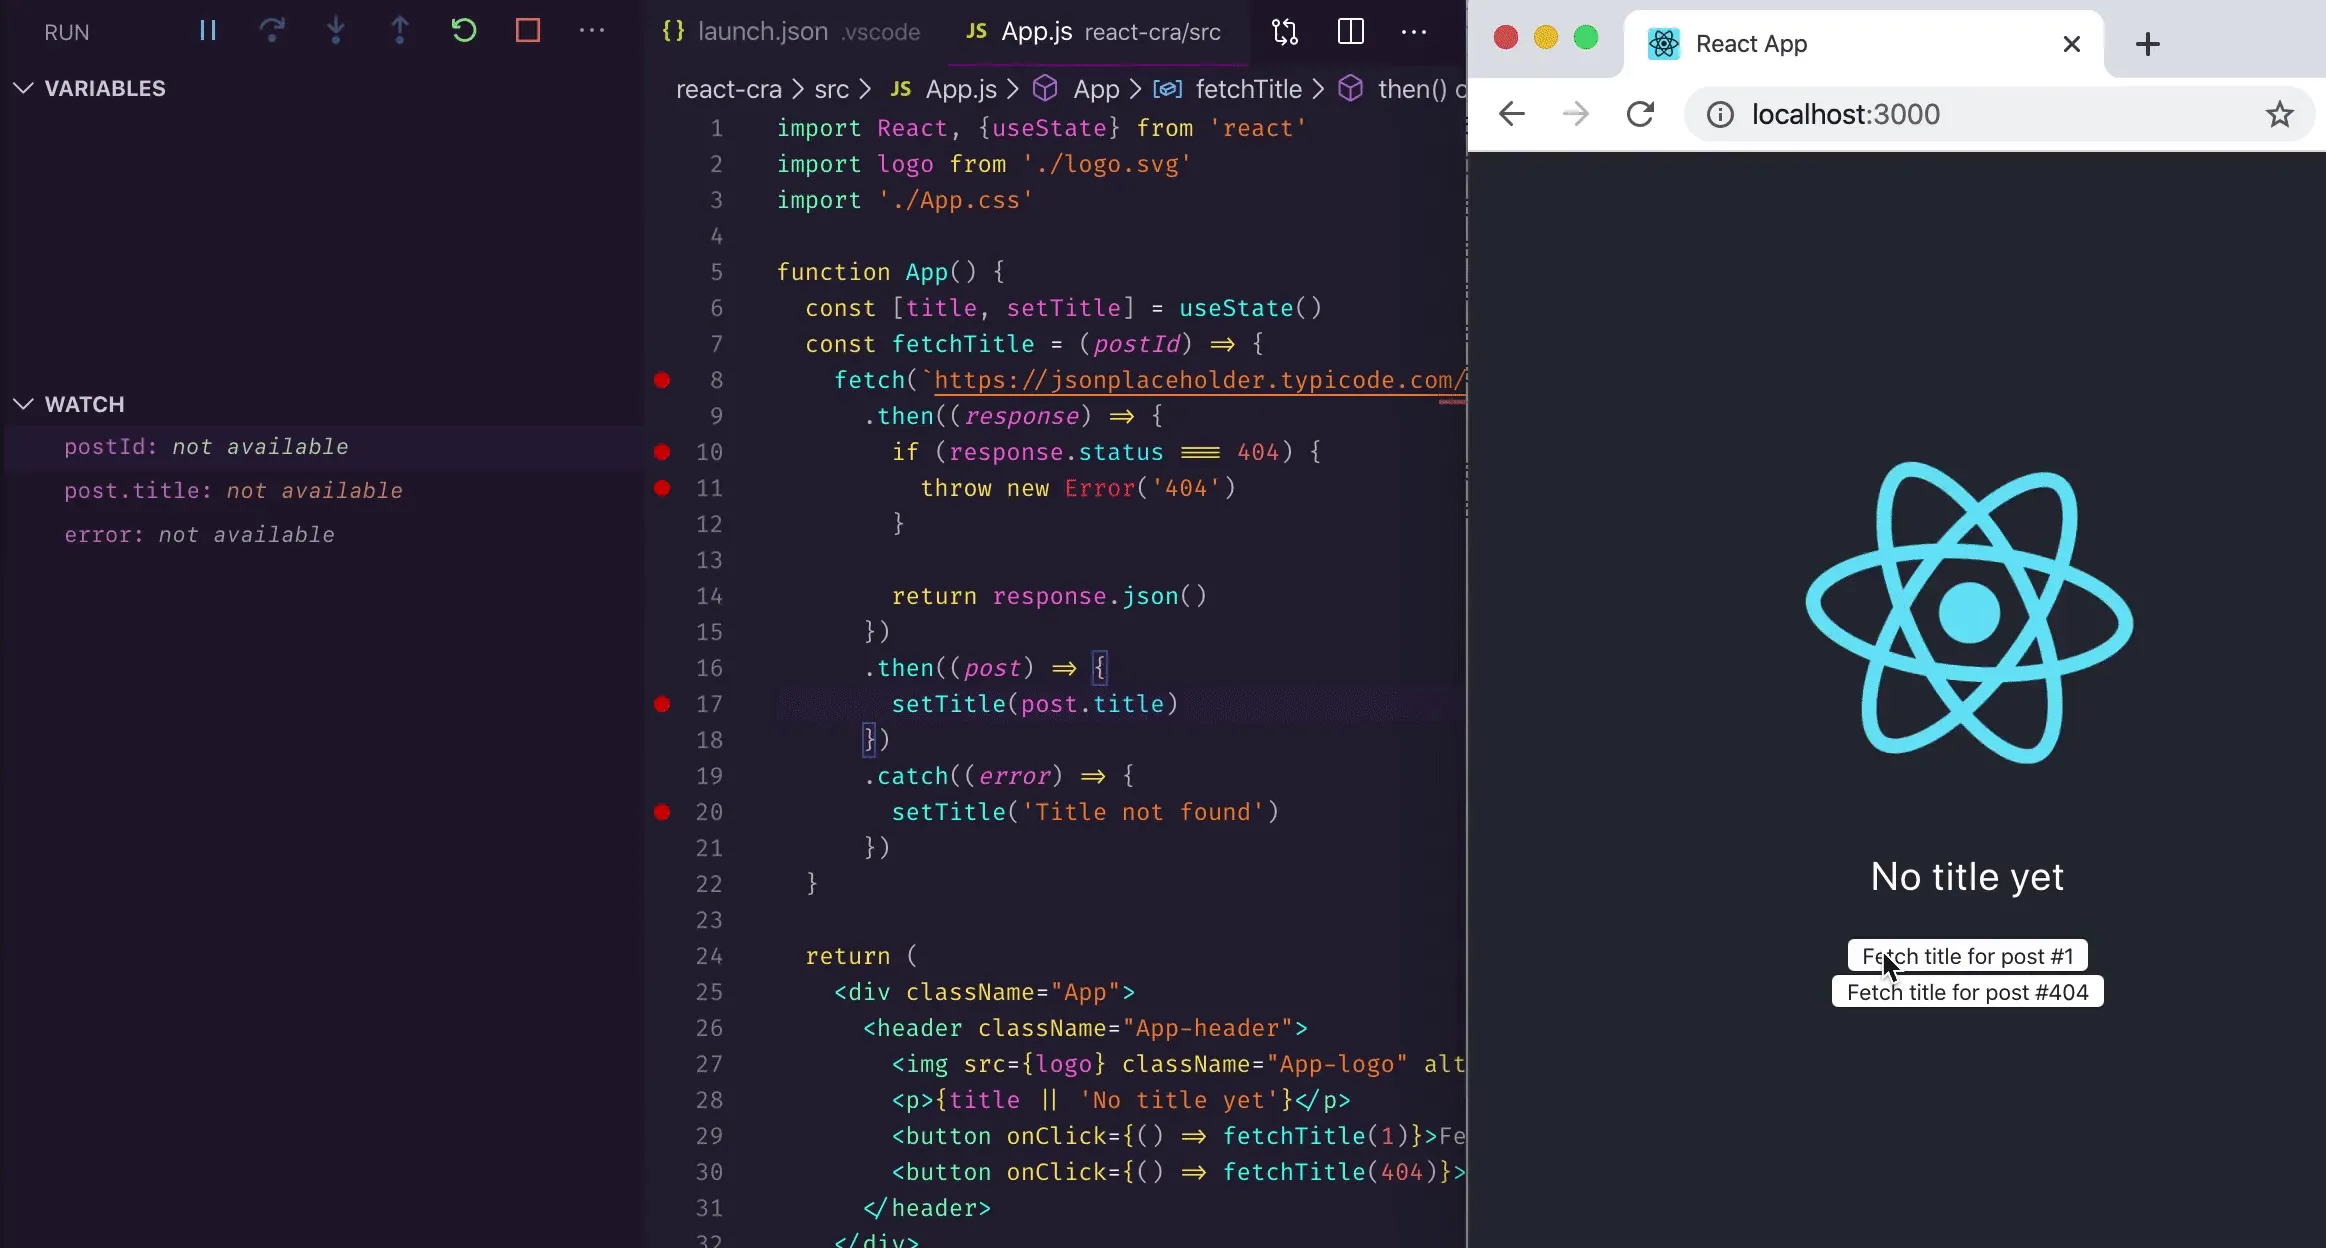
Let’s try to fetch an existing post and keep an eye on the expressions:
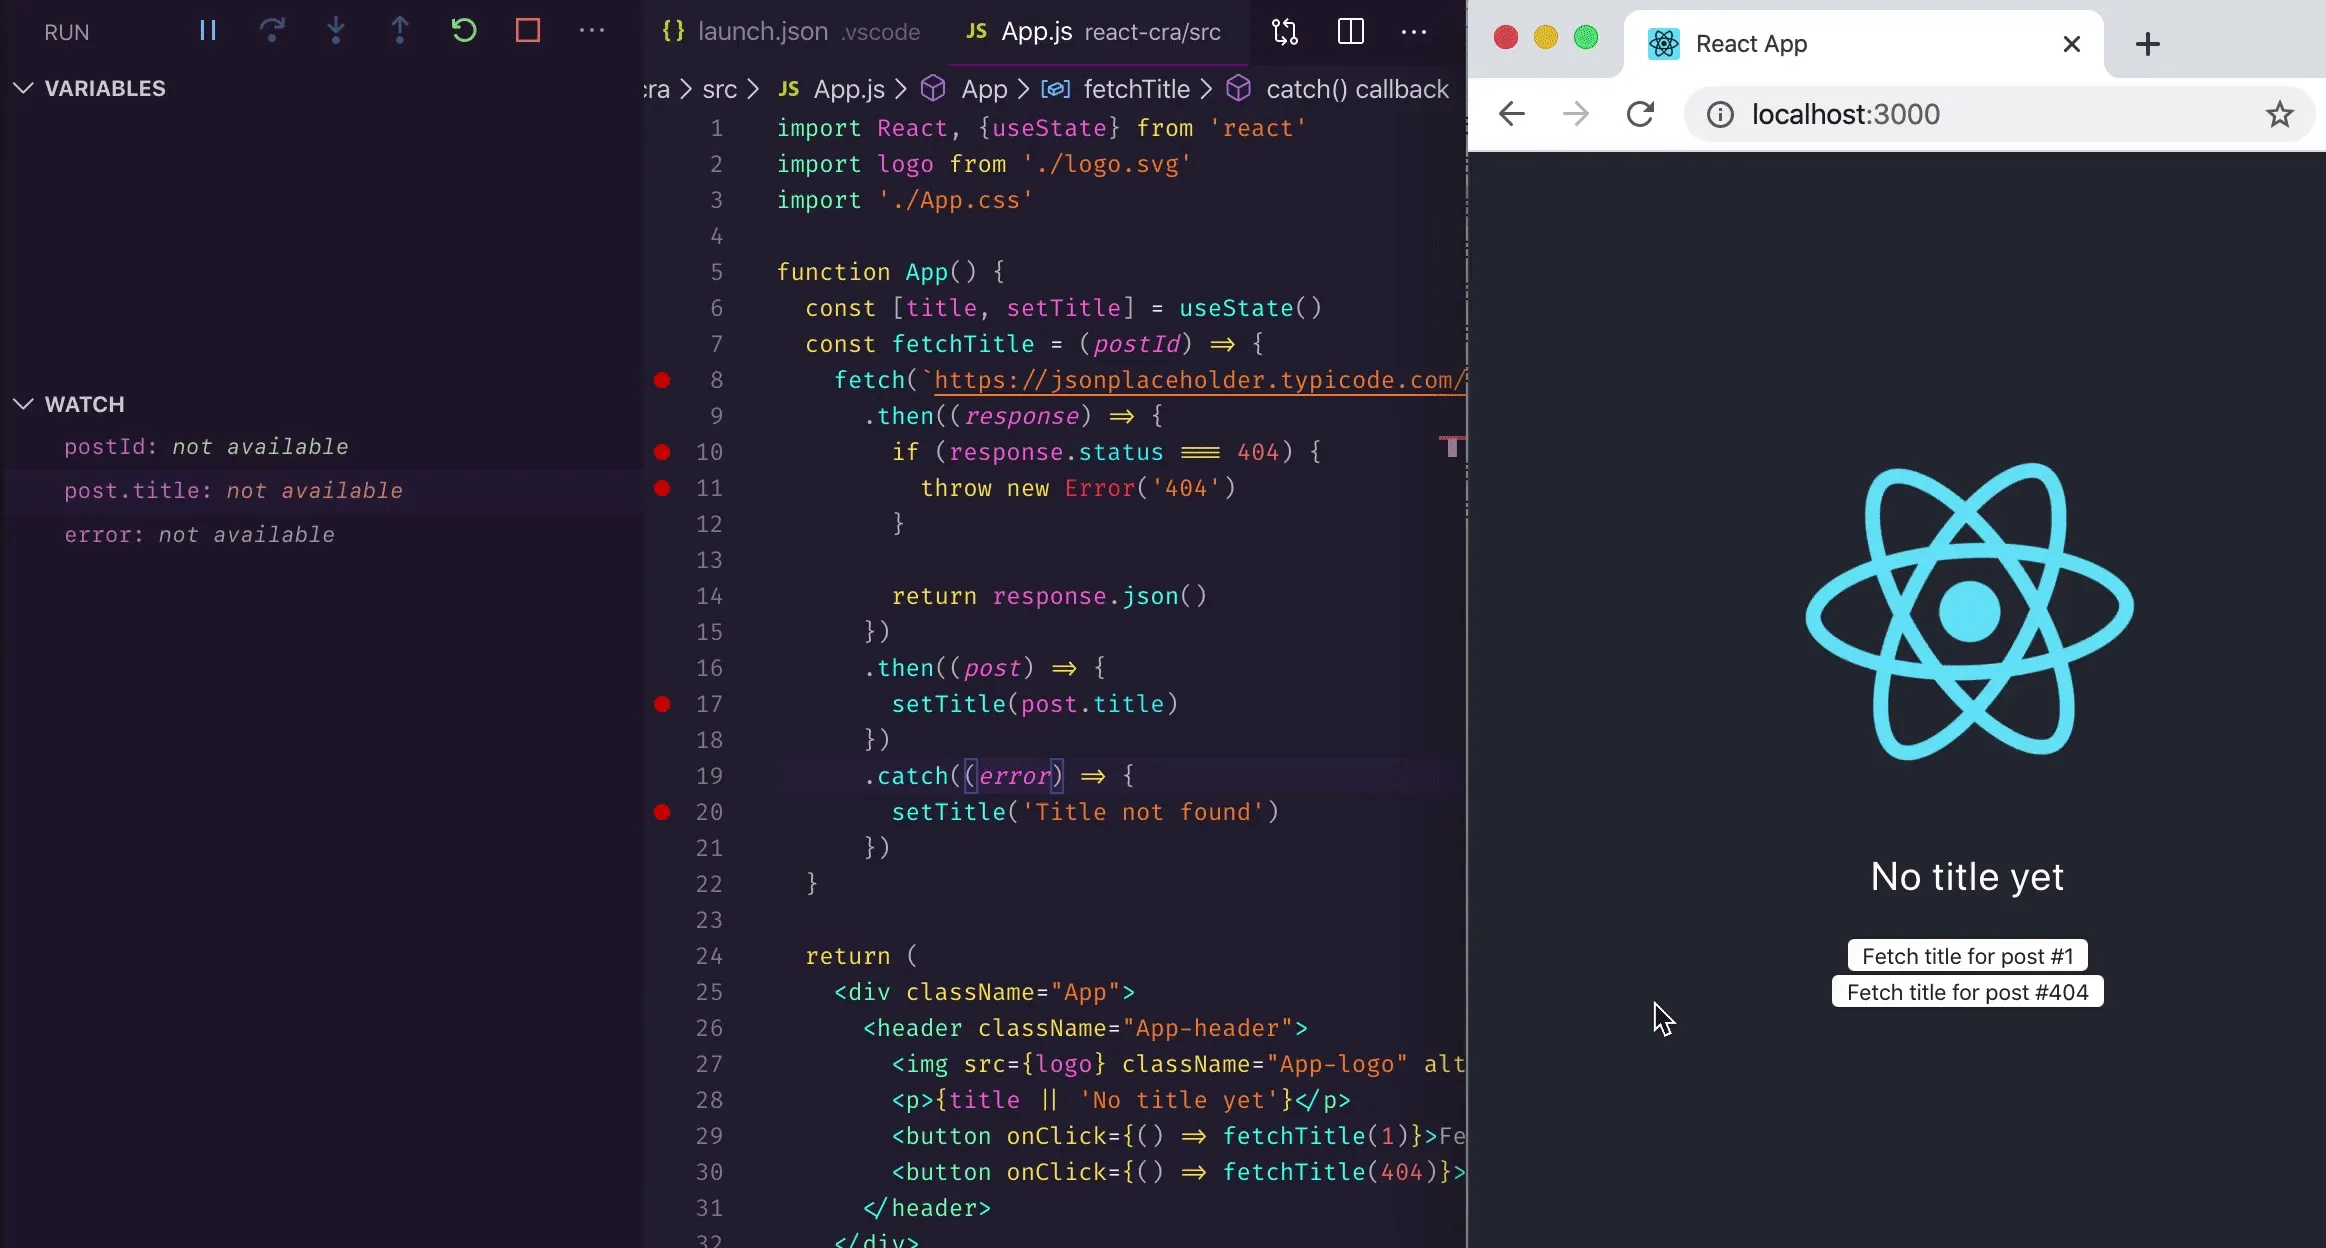
With these expressions, it’s easy to inspect the unhappy path too - keep an eye on the error this time:
As you might have guessed, the method we used above applies to any browser-based app. The setup is roughly the following in these cases:
- Start the development server
- Configure your
launch.jsonto open the app in the debugging browser - Set breakpoints in your source code
- Set watch expressions when you repeatedly inspect the same property
- Use step commands to inspect the code flow
- Restart functions or the whole app